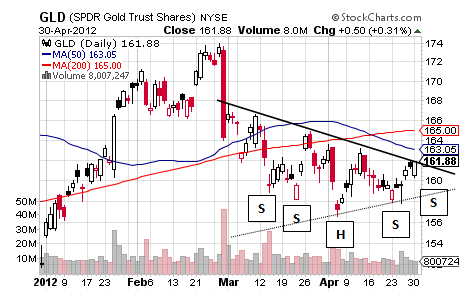
Let’s look at three charts of GLD with the first showing a possible Inverse Head and Shoulders pattern.
This pattern, like the larger one below, is disproportionately large relative to the decline it may reverse, and thus looks more like a Symmetrical Triangle that may break to the downside. Let’s treat both sides, then, and those are $157.76 for downside confirmation for a target of $147.77 while upside confirmation occurs at $163.20 for a target of $173.19.
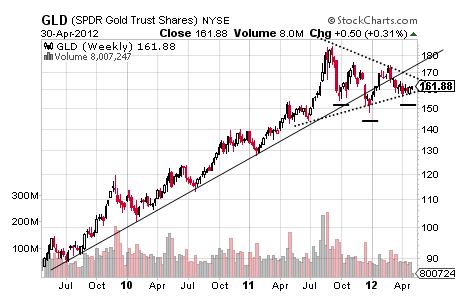
Turning to the chart below, it is quickly clear that GLD is beautifully fractal and that it is trying to reverse its 3-year uptrend. 
Those issues of proportion quickly jump out too and so it makes sense to simply skip to the two sides of the larger Symmetrical Triangle with the downside confirming near $148 for a target of about $111 while the upside confirms at $174 for a target of about $222. In turn, fulfillment of the smaller Sym Tri in either direction will serve to confirm the larger pattern.
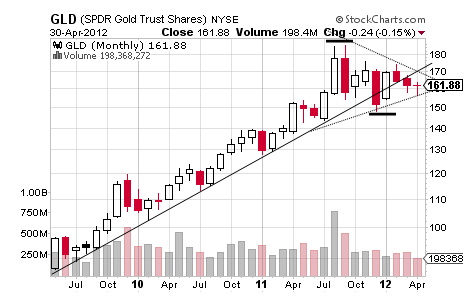
One reason to believe it will be to the downside besides the reversal of GLD’s long-term uptrend is shown in the monthly chart below. 
It is showing a very powerful Pipe Top from last August and September that has fought off a weak Pipe Bottom between December and January, and thus it seems the topping pattern is more likely to prevail.
Before looking at those numbers, though, let’s look at the Pipe Bottom too in the case that it comes back and it confirms at $170.80 for a target $193.33, and thus an upside breakout of the small Symmetrical Triangle would confirm it as well.
It is the Pipe Bottom, though, that looks stronger and it confirms at $154.19 for a target of $122.54 and a level that is not so far from the downside target of the larger Symmetrical Triangle and perhaps another reason to believe it breaks that way.
In fact, based on the combination of these many charts, it seems fair to say that GLD is bearish and possibly very bearish.
- English (UK)
- English (India)
- English (Canada)
- English (Australia)
- English (South Africa)
- English (Philippines)
- English (Nigeria)
- Deutsch
- Español (España)
- Español (México)
- Français
- Italiano
- Nederlands
- Português (Portugal)
- Polski
- Português (Brasil)
- Русский
- Türkçe
- العربية
- Ελληνικά
- Svenska
- Suomi
- עברית
- 日本語
- 한국어
- 简体中文
- 繁體中文
- Bahasa Indonesia
- Bahasa Melayu
- ไทย
- Tiếng Việt
- हिंदी
Why The GLD ETF Is Bearish
Latest comments
Loading next article…
Install Our App
Risk Disclosure: Trading in financial instruments and/or cryptocurrencies involves high risks including the risk of losing some, or all, of your investment amount, and may not be suitable for all investors. Prices of cryptocurrencies are extremely volatile and may be affected by external factors such as financial, regulatory or political events. Trading on margin increases the financial risks.
Before deciding to trade in financial instrument or cryptocurrencies you should be fully informed of the risks and costs associated with trading the financial markets, carefully consider your investment objectives, level of experience, and risk appetite, and seek professional advice where needed.
Fusion Media would like to remind you that the data contained in this website is not necessarily real-time nor accurate. The data and prices on the website are not necessarily provided by any market or exchange, but may be provided by market makers, and so prices may not be accurate and may differ from the actual price at any given market, meaning prices are indicative and not appropriate for trading purposes. Fusion Media and any provider of the data contained in this website will not accept liability for any loss or damage as a result of your trading, or your reliance on the information contained within this website.
It is prohibited to use, store, reproduce, display, modify, transmit or distribute the data contained in this website without the explicit prior written permission of Fusion Media and/or the data provider. All intellectual property rights are reserved by the providers and/or the exchange providing the data contained in this website.
Fusion Media may be compensated by the advertisers that appear on the website, based on your interaction with the advertisements or advertisers.
© 2007-2025 - Fusion Media Limited. All Rights Reserved.
