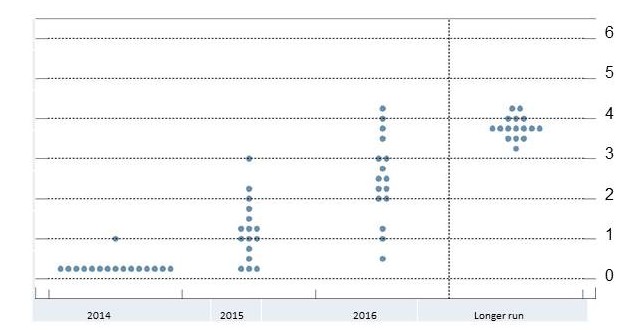
The chart above doesn’t look like much, but it represents a snapshot of the thinking of the Federal Open Market Committee (FOMC) on interest rates. Their communication has come a long way since the days of cigar-chomping Paul Volcker in the 1970s, when they went out of their way to disguise their intentions. Alan Greenspan inherited this culture and while in his early years he clearly relished confounding Senators with his unintelligible responses during Congressional testimony, over time he initiated a move towards greater transparency around the Fed’s decision making process and objectives. Ben Bernanke continued this and no doubt the trend will be maintained under Janet Yellen.
On the chart above (reproduced from the Fed’s website), each dot represents the view of a single FOMC member on the year-end level for short term interest rates (specifically, the Fed Funds rate). There are 16 voting members and each provides a forecast for the end of this year, 2015, 2016 and the long term. I’ve been watching these releases for nearly three years because over time they provide a fascinating picture of their evolving interest rate views.
The first three annual forecasts (2014-2016) can almost be used to construct a yield curve. Indeed, interest rate futures contracts are now often described as priced above or below the Fed’s forecast. Of course, their rate forecast can be wrong, just as the economic forecasts on which it’s based can be. Circumstances change, and there’s nothing intended to be inflexible about these figures. But it does allow us to see more clearly whether economic events alter their view. For example, U.S. GDP growth in the first quarter was quite weak at -1.5%, due largely to the harsh winter those of us in the north east endured. However, the FOMC has a reasonably positive view of growth for the remainder of the year (2.1%-2.3% for all of 2014 which implies around 3.4% on average for the remaining three quarters). As a result, they very modestly tweaked their rate forecasts higher over 2015-2016 (by about 0.07%-0.10%).
More significantly in my view, their long run forecast of interest rates fell from 4.0% to 3.75%. This is the equilibrium rate at which they think rates should settle assuming they had no bias to run monetary policy with either an accomodative bias (as it is now) or a restrictive one. 3.75% is neutral. It takes account of their long run estimate of inflation and of GDP growth.
Back in early 2012, their median long run forecast for rates was 4% and they raised it to 4.25%. They brought it back down to 4% last Summer and then 3.75% yesterday. If their forecast is right (and their forecasts are more important than anybody else’s) it means the fair value yield for, say, a ten year treasury security is a little lower. An investor now ought to be willing to hold it at a somewhat lower yield than before since in theory a ten year bond represents roughly the average short term yield over that period of time.
Steve Liesman from CNBC picked up on this and asked Janet Yellen in her press conference yesterday what was behind this shift. She noted that the composition of the FOMC had changed since the last forecast in March which might make the comparison less meaningful (two voting members were replaced according to a rotating schedule). But she conceded that it also probably reflected a more modest view of long term GDP potential in the U.S. economy.
For investors, it confirms what we’ve long felt, which is that interest rates are likely to stay relatively low for a long time. The Fed’s not about to make bonds more attractive by pushing rates sharply higher, so they will remain a fairly unattractive investment choice. And while you can’t infer too much about equities from the Fed’s interest rate view, it still seems likely that stocks will provide superior long term returns compared with bonds over the medium term.
