In our December 14 ETF trading commentary, we pointed out the bearish shooting star candlestick pattern that the S&P 500 SPDR ETF (SPY) formed on its longer-term weekly chart interval. The rest of the major indices closed with the same topping pattern on their weekly charts.
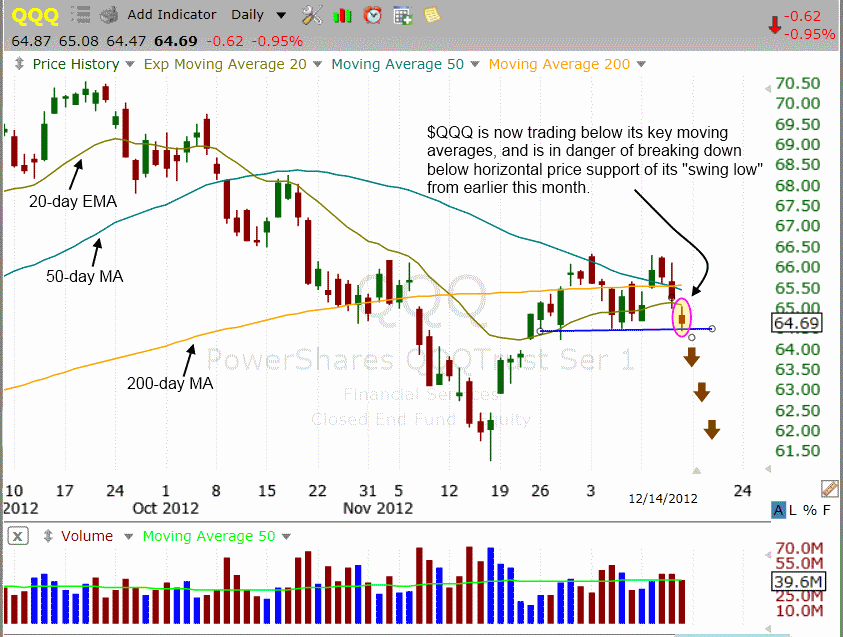
Last Friday, we also illustrated the bearish pattern and relative weakness in PowerShares QQQ Trust ETF (QQQ), a popular ETF for trading the Nasdaq 100 Index. On the updated daily chart below, notice that QQQ is now trading below its 20, 50, and 200-day moving averages, each of which should now act as resistance on any bounce attempt. The blue horizontal line marks horizontal price support of the recent “swing lows” set earlier this month:
As marked by the brown, downward facing arrows, we anticipate that a break of horizontal price support in QQQ will swiftly lead to a retest of the prior low from mid-November. Why?
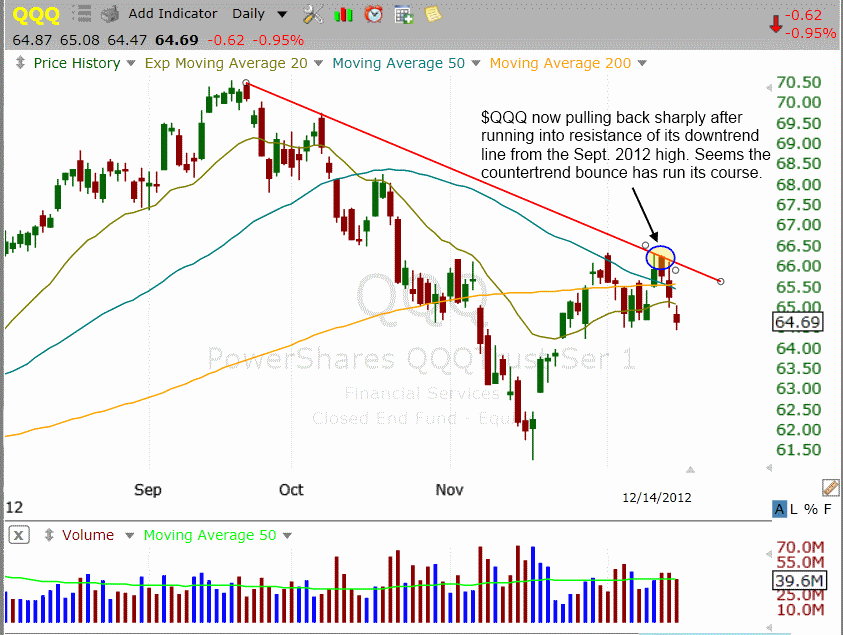
The reason is simply that the stock market rally off the mid-November lows has technically been nothing more than a countertrend bounce from near-term “oversold” conditions. Now, it looks as though the rally may have already run its course, as QQQ has run into major resistance of its downtrend line from the September 2012 high.
Below is a second daily chart of QQQ, which clearly illustrates how the ETF reversed after bumping into its multi-month downtrend last week (the red descending line):
We recently profited in a few ETF and stock swing trades on the long side after our system for timing the stock market shifted to “buy” mode. Yet, we were still fully aware at the time that the rally off the lows had not yet proven itself to be anything more than a countertrend bounce within the dominant downtrend.
This is one of several reasons our market timing system shifted from “buy” to “neutral” mode on December 13, after several major indices formed “shooting stars” on their weekly charts while running into the downtrend lines from their September 2012 highs. Furthermore, if selling pressure in the broad market persists and we receive the necessary signals, the timing model may soon revert back to “sell” mode. We locked in solid profits on the short side of the market (and through inversely correlated “short ETFs”) when our stock market timing system was formerly in “sell” mode throughout most of October and part of November.
Going into today, we have “officially” added ProShares UltraShort QQQ (QID) to our watchlist as a potential ETF to buy for swing trade entry. This inversely correlated ETF that tracks the price action of QQQ, but moves in the opposite direction. We are looking to buy QID, rather than sell short QQQ, because readers with non-marginable cash accounts are unable to initiate short positions, but are not restricted from buying “short ETFs” such as QID. Also, even though it is leveraged, QID has shown only fractional underperformance to its underlying index for short-term trading.
Our short setup in iShares Nasdaq Biotechnology Index (IBB) remains on our watchlist as a candidate for potential swing trade short sale entry going into today (December 17).
As for the long side of the market, many international ETFs continue to show clear relative strength and bullish price divergence to the US markets. A handful of these ETFs even closed at fresh 52-week highs last Friday.
We recently profited from the sale of two ETF swing trades on the long side of the market, the iShares FTSE China 25 Index Fund ETF (FXI) and the iShares MSCI Poland Investable Market Index ETF (EPOL), and we continue to monitor select international ETFs for potential buy entry on a pullback. When emerging markets ETFs start forming price retracements that present positive reward to risk ratios for buy entry, we will highlight and bring to your attention some of the better-looking charts for possible buy entry.
But other than international ETFs, there are practically no industry sector or other domestic ETFs on the long side of the market to get excited about.
Original post
- English (UK)
- English (India)
- English (Canada)
- English (Australia)
- English (South Africa)
- English (Philippines)
- English (Nigeria)
- Deutsch
- Español (España)
- Español (México)
- Français
- Italiano
- Nederlands
- Português (Portugal)
- Polski
- Português (Brasil)
- Русский
- Türkçe
- العربية
- Ελληνικά
- Svenska
- Suomi
- עברית
- 日本語
- 한국어
- 简体中文
- 繁體中文
- Bahasa Indonesia
- Bahasa Melayu
- ไทย
- Tiếng Việt
- हिंदी
Why The Countertrend Bounce In The Nasdaq Has Run Its Course
Published 12/17/2012, 12:10 AM
Why The Countertrend Bounce In The Nasdaq Has Run Its Course
Latest comments
Loading next article…
Install Our App
Risk Disclosure: Trading in financial instruments and/or cryptocurrencies involves high risks including the risk of losing some, or all, of your investment amount, and may not be suitable for all investors. Prices of cryptocurrencies are extremely volatile and may be affected by external factors such as financial, regulatory or political events. Trading on margin increases the financial risks.
Before deciding to trade in financial instrument or cryptocurrencies you should be fully informed of the risks and costs associated with trading the financial markets, carefully consider your investment objectives, level of experience, and risk appetite, and seek professional advice where needed.
Fusion Media would like to remind you that the data contained in this website is not necessarily real-time nor accurate. The data and prices on the website are not necessarily provided by any market or exchange, but may be provided by market makers, and so prices may not be accurate and may differ from the actual price at any given market, meaning prices are indicative and not appropriate for trading purposes. Fusion Media and any provider of the data contained in this website will not accept liability for any loss or damage as a result of your trading, or your reliance on the information contained within this website.
It is prohibited to use, store, reproduce, display, modify, transmit or distribute the data contained in this website without the explicit prior written permission of Fusion Media and/or the data provider. All intellectual property rights are reserved by the providers and/or the exchange providing the data contained in this website.
Fusion Media may be compensated by the advertisers that appear on the website, based on your interaction with the advertisements or advertisers.
© 2007-2025 - Fusion Media Limited. All Rights Reserved.
