Investing.com’s stocks of the week
This post was written exclusively for Investing.com
The dramatic plunge in the 10-year Treasury yield over the past six months may have been no more than a taste of things to come, according to the technical charts: the patterns currently emerging are sending a strong signal that we could be on the verge of an even steeper decline.
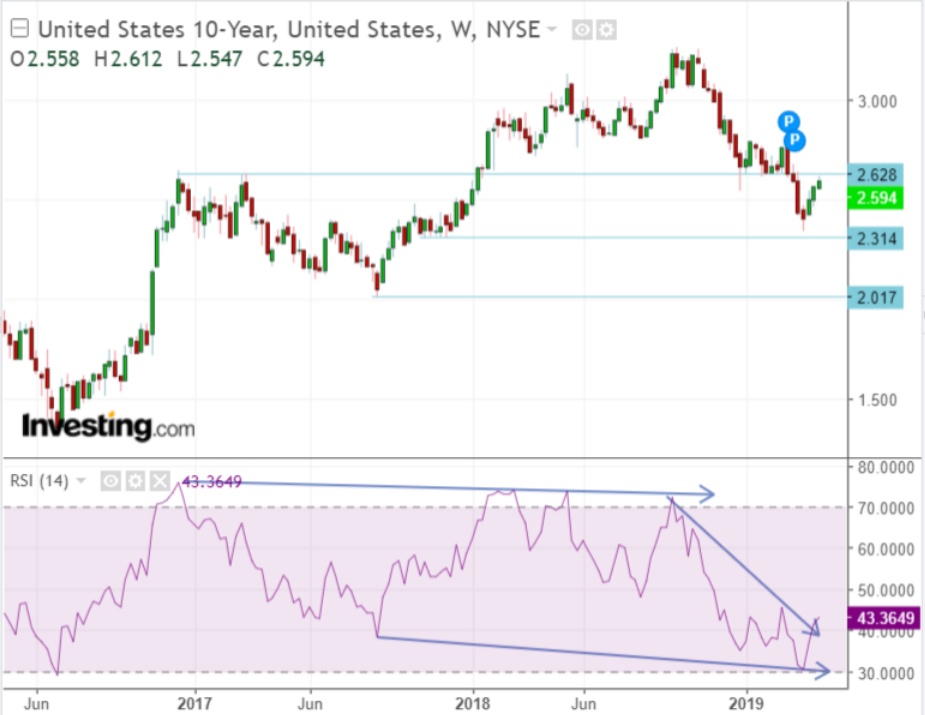
Since November, 10-year yields have dropped to around 2.6% from a high of 3.25%. At the same time, inflation in the U.S. remains low, and the Federal Reserve has flagged it's unlikely to raise rates in 2019. Add that to the end of the balance sheet unwind, and the potential for the Fed to purchase up to $20 billion per month in Treasuries this fall, then throw in a European Central Bank in the process of easing monetary policy, and suddenly you have a recipe for interest rates to tumble even further — potentially even to as low as 2%.
Technical Decline
The chart shows that the 10-year yield is approaching a significant level of technical resistance at 2.62%. Should yields fail to break out and reverse, rates could fall back to a technical level of support at 2.3%. A drop below 2.3% sends yields even lower — perhaps as far down as 2%.
The relative strength index (RSI) is also suggesting yields will fall in the future. The RSI topped out at an overbought level above 70 in late 2016 and had been trending lower despite yields continuing to rise, a bearish divergence. Now the RSI is trending even lower, suggesting yields will continue to fall.

Chart powered by TradingView
Spreads Are The Widest in 30 Years
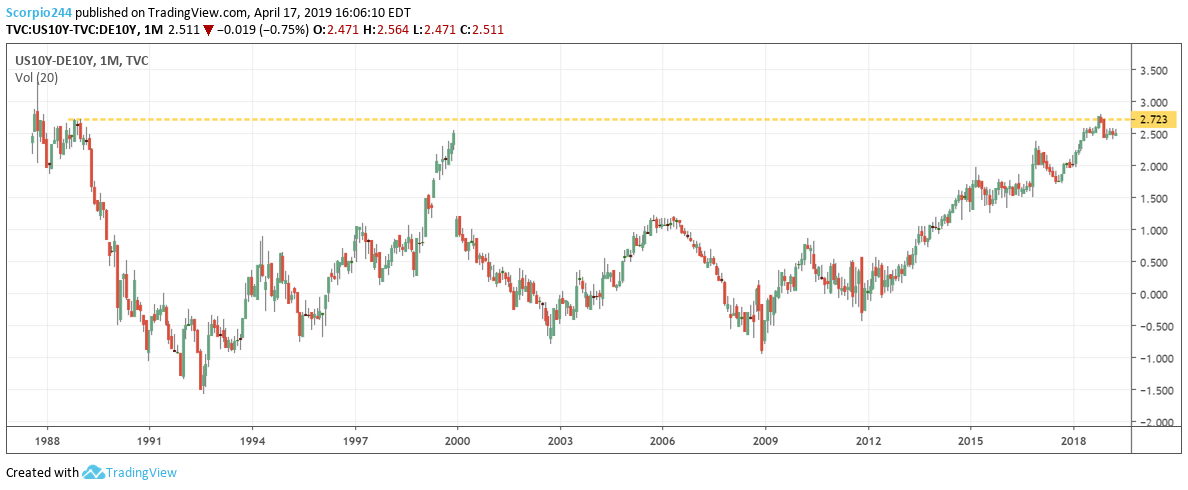
Spreads between the U.S. and German 10-year yields reached their widest points since 1989 at nearly 2.75% in late 2018. The spread has narrowed some in recent months to around 2.5% recently, but still, that is nearly 100 basis points wider than at any point from 2014 to 2016, and 250 basis points wider than in 2012. It shows just how much interest rates in the U.S. have climbed in recent years, while rates around the world have remained low.
For the U.S.-German spread to contract further, the U.S. bond yields would need to fall as German Bund yields increased. However, given the easing taking place in Europe by the ECB and with the Fed on hold, it is more likely that U.S. yields will continue to fall.

Low Inflation
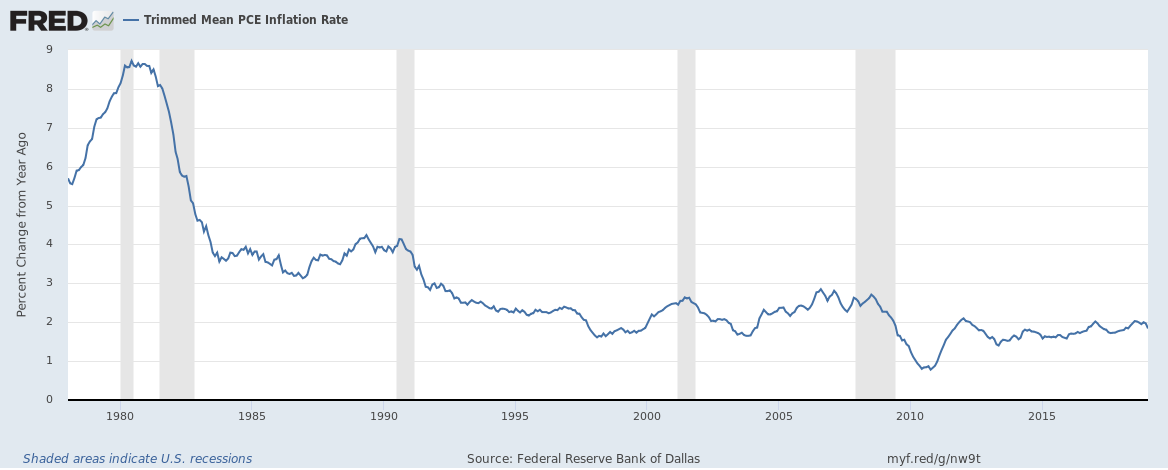
One reason why monetary policy in the U.S. has shifted is due to low inflation rates. For example, the trimmed mean PCE index is currently showing a year over year increase of just 1.84%. The index has not shown a meaningful reading above 2% since February 2009 when it was 2.27%.

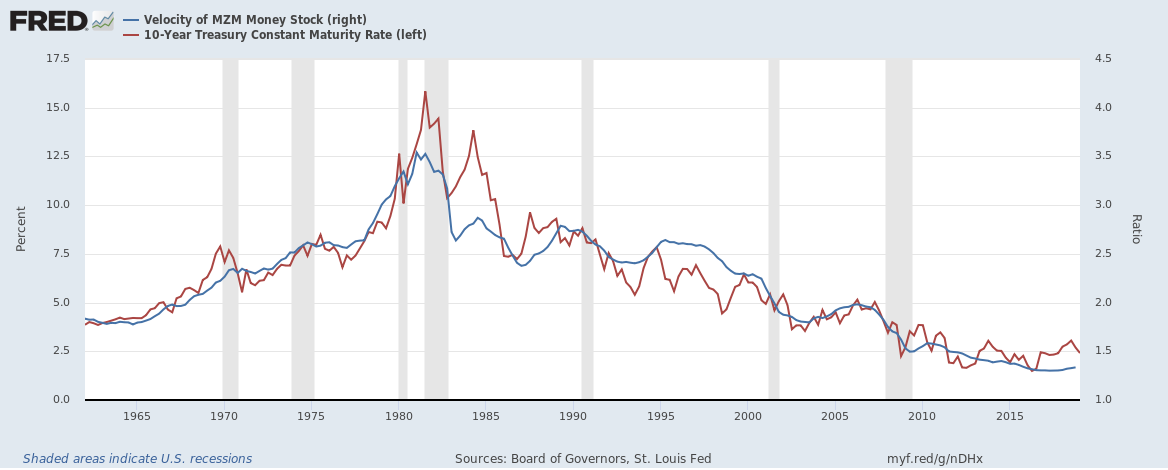
Another critical reading which is highly correlated to interest rates is the velocity of MZM money supply. The velocity of MZM has a correlation with the U.S. 10-year yield of 0.93 with an R^2 of 0.86, making the correlation statistically significant. The velocity of MZM can be thought of as a measure of inflation for the U.S. economy. For example, $1 created in MZM money supply in 1980 created nearly $3.56 in GDP, while today $1 in MZM creates just $1.33 in GDP. The velocity of MZM has shown no improvement in recent years and continues to remain at a depressed rate, suggesting that inflation and yields are likely to remain low as well.

$20 Billion per Month
The Fed plans to stop winding down its balance sheet later in 2019. However, the U.S. central bank will have about $20 billion worth of Mortgage Backed Securities maturing a month as well. In order to keep the balance sheet constant, the Fed will reinvest that money into Treasuries. It does not matter that this money is not newly created; it still puts a large buyer into the market place and will help push rates lower.
With inflation rates low, an ECB easing up on monetary policy, and the Fed on hold, it seems hard to create a narrative that suggests interest rates in the U.S. will rise anytime soon. Unless one of these pieces of the equation changes, it will be challenging to come up with a new view. If yields remain under pressure a drop to 2% does not seem all that difficult to imagine.
