Many stock markets are only marginally off record highs and yet there's already a growing chorus of calls for a larger correction or crash. Comparisons to 2008, 1999, 1987 and 1929 are all the rage. The Internet can be partially blamed for this "noise" as financial bloggers revert to sensationalism to get attention amid the cacophony of market commentary. But it also speaks to the enduring psychological damage to investors from the 2008 financial crisis. Fears that every correction will result in a crash remain front of mind.
The market pullback has certainly let the bears come out to play. Well-known commentator, Marc Faber, aka Dr Doom, appeared on television with a twinkle in his eyes to declare a likely re-run of 1987, but worse. Faber suggested the S&P 500 would fall 30% this year. The only problem is that he's been talking of a market crash for more than two years and it hasn't happened (see here and here).
Henry Blodget of Business Insider also reiterated his less precise, albeit more dire, market call this past week. He thinks the US market could drop up to 50% over the next 1-2 years. He bases this on expensive valuations, all-time high corporate margins which are likely to mean-revert and Fed tightening effectively taking away the punch bowl.
Asia Confidential believes Blodget makes a number of valid arguments and could end up being right. But he's way to early with the call. And the principal reason is that history shows Fed tightening has been bullish for stocks, at least initially.
Today's post will explore Blodget's views in detail, the holes therein as well as the more plausible risk to markets in the short-term: a deflationary bust precipitated by Japan and/or China.
A Blodget crash
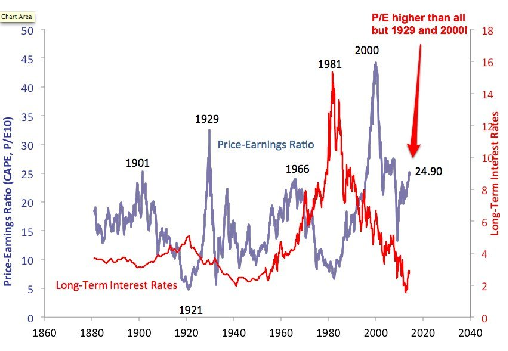
Henry Blodget is the renowned CEO and Editor of Business Insider, the financial news website. He's more famously known as the former equities analyst who made some big buy calls on bubbly Internet stocks in the late '90s. He was banned from the securities industry for private emails which conflicted with the bullish advice that he was providing clients.The Shiller PER currently sits at 25x, way above the historical average of 15x. It's only been at these levels twice over the past century, in 1929 and 2000. We all know what happened in those years.
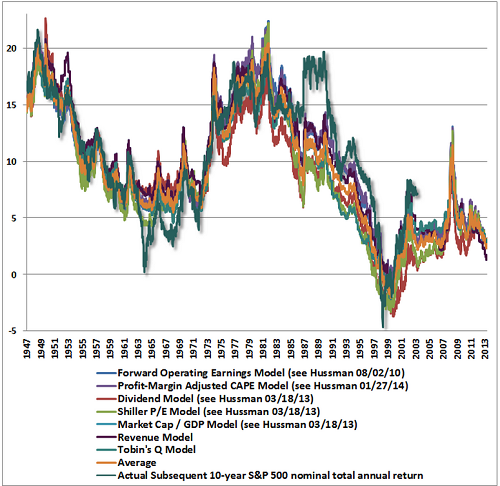
And if you don't believe the Shiller PE, Blodget says there are a host of other valid methodologies which point to significant market over-valuation. The below chart shows the average return for the next decade forecast by these methodologies is just 2%, well below the historical average 10% returns of the S&P 500. Therefore, even if there isn't a crash, you can expect poor returns from US equities going forward.
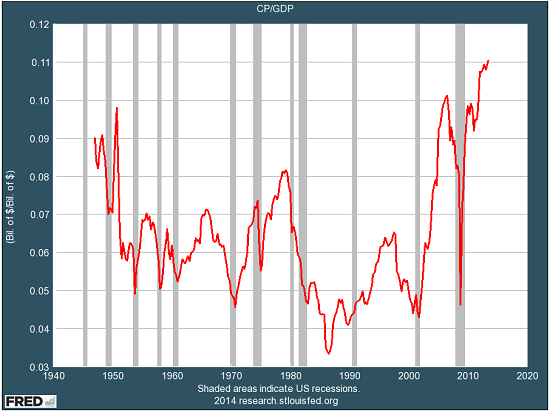
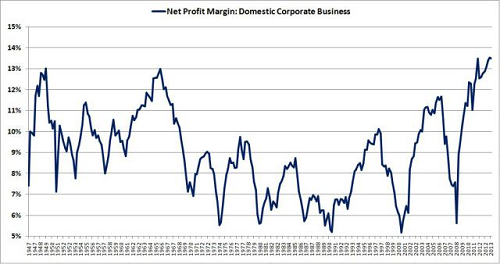
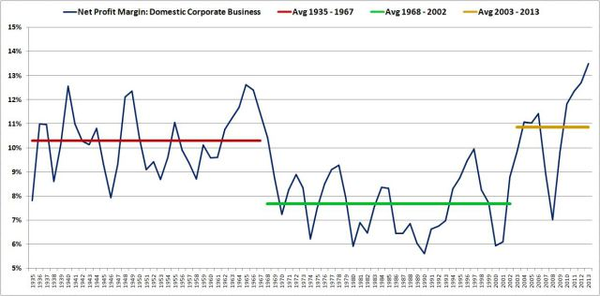
2) Record-high corporate margins should mean-revert. Blodget acknowledges that the current S&P PER of 15x is in line with the long-term historical averages. However, he says this is a distortion caused by current high profit margins. These margins are far above anything seen in the past. Notably, these margins almost always mean-revert. And that means they're likely to be heading down, impacting earnings and ultimately valuations.
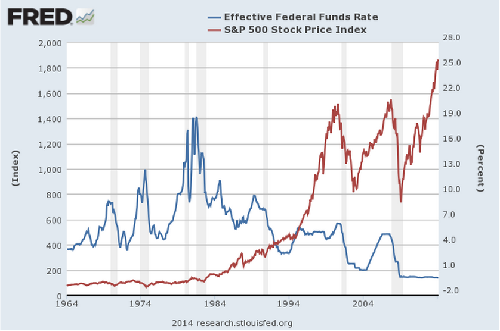
3) Fed tightening has often been bad for stocks. Blodget's final point is that history shows rising interest rates have normally preceded significant market corrections. Given the Fed has forged ahead with QE tapering and foreshadowed a rise in rates from next year, that doesn't bode well.
Holes in the argument
Let's tackle the argument one-by-one. To the first point, I agree that the US market is overvalued. From a global standpoint, it's one of the few big markets which appears pricey. The likes of Asia are cheap in comparison, perhaps for a reason.
Yes, the Shiller PE has its critics. They point to the ratio only indicating market under-valuation 2% of the time over the past two decades, making for a dubious methodology. I doubt this invalidates it but just indicates that the S&P 500 has been mostly expensive over that time frame.
It's also important to note that other valuation methodologies which suggest a similar levels of over-valuation, such as Tobin's Q, have received much less criticism. Tobin's Q, in particular, has been proven robust.
To the second point, Blodget overstates the case. Yes, US corporate margins are at record highs, but not to the extent he would have it.
The recent lift-off in margins is partly due to an accounting quirk. US corporations have been earning more from overseas (40% of total). Foreign sales are included in the corporate earnings/GDP ratio but costs are excluded. This effectively means overseas operations are treated as earning 100% margins.
As the blog, Philosophical Economics, points out, if you remove this accounting quirk, corporate margins aren't so wildly elevated. Critically too, there are long periods such as 1947-1967, where margins stay high ie. they don't mean-revert as readily as many suggest.
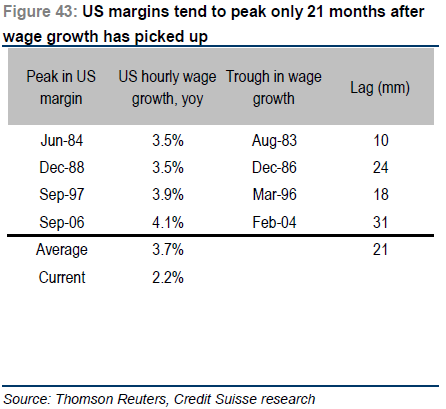
Another critical point is that margins have historically peaked an average 21 months after wage growth has picked up. And the wages component of the Employment Cos Index is broadly flat at present.
In my view though, the third point of Blodget's argument is the most problematic. Blodget suggests that Fed tightening has typically been bad for stocks. That's not quite right. In fact, the early stages of interest rate rises have been positive for stocks on most occasions, as the below chart from Ken Fisher shows.
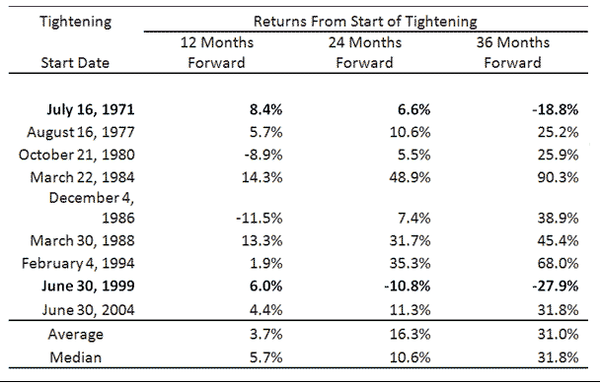
At no stage over the past century has the S&P 500 peaked prior to or after the first rate rise. Moreover, cyclical bull markets have been one-third the way through when the first rate increase occurs. Market peaks have been reached three years after the initial rate hike, on average. The shortest lag between first rate increase and market peak has been one-and-a-half years in the late '60s.
Typically, the Fed has been slow to aggressively hike rates to tame inflation, and tightening together with a slowing economy has led to recession.
Given the Fed won't start raising rates until next year at the earliest, history would suggest the market may not peak for another two-and-a-half years at a minimum. And that makes Blodget's forecast of a market crash improbable.
A secular bear?
To be clear, that doesn't completely rule out a market crash at this juncture. Anything can happen. However, it does make it more likely that the current pullback will prove a correction before the market grinds higher. And a more serious correction lays down the track. At least that's what the history books tell us.
Blodget doesn't say it but his call bears the imprints of a secular bear. His crash forecast effectively suggests that we may be heading into the final stages of a secular bear market.
Secular bull and bear markets are long cycles of rising and falling markets. Cyclical bull markets can occur within secular bear markets and vice versa.
The average bear market in the US over the past century has lasted 18 years. There's a view - to which I subscribe - that the US entered a bear market in 2000. And that bear market hasn't yet finished.
Mind you, there's lots of different opinion on this issue. Some think the bear market ended in 2009, making it the shortest of any bear market of the past 100 years. Others believe the secular bear market only started in 2009 and therefore we have a way to go.
What is beyond dispute is that PERs, not earnings, drive secular cycles. During secular bull markets, PERs often start in single digits and move sharply higher before heading down during a secular bear market.
The interesting part is what drives PERs higher and lower. The answer is the longer-term trend of the inflation rate. Moving from high inflation towards lower inflation typically drives PERs higher and thus markets higher. Transitioning from low inflation to a period of high inflation or deflation normally drives PERs lower, and markets lower too.
Why do these things happen? Well, when inflation and interest rates are high, investors want higher returns and therefore will pay a lower upfront price for stocks. When there's deflation, future earnings and dividends are assumed lower and investors will want to pay a lower upfront price as well. Conversely, with low inflation and interest rates, investors are willing to pay a higher price for stocks, which drives up PERs.
The upshot is that given current low inflation, the risk for markets comes from higher inflation or deflation. Higher inflation doesn't become a major problem for markets until it reaches 4%. Beyond that point, PERs start to significantly decline.
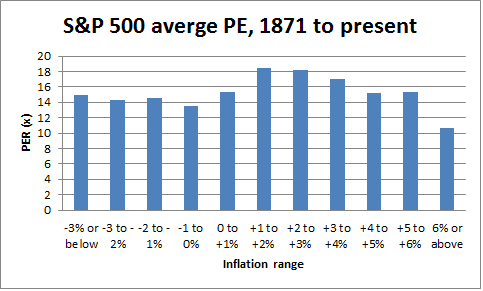
Therefore, a Fed tightening cycle isn't a concern until inflation hits 4% and we're a long way from that point. On the other hand, there's the risk of deflation. For Blodget's thesis to be proven correct, a deflationary bust is the more likely scenario to make that happen.
The deflationary threat
Deflation is the number one bogeyman of central bankers. While the US tapers stimulus, Europe is expected to undertake more QE soon and Japan and China may follow suit.
The risks from Europe, Japan and China simultaneously conducting further bouts of QE to depreciate their currencies can't be underestimated. History shows currency wars often lead to trade wars, which negatively impact global trade.
In this context, Asia Confidential sees Japan as the biggest wildcard and greatest risk. Any objective assessment of Abenomics would suggest that it's failing. And that could well result in more unconventional and inherently dangerous policy moves.
The Japanese Prime Minister, Shinzho Abe, took office 17 months ago with the aim of reflating the country's ailing economy. He's printed truckloads of money to depreciate the yen in a bid to revive trade and put the current account firmly in positive territory.
The only problem is that while the yen has fallen more than 20% against the US dollar, export growth has been tepid and the current account has markedly deteriorated.
The key issue is that households are being squeezed. Wages are declining. Savings are earning almost nothing as QE keeps rates low. Costs are rising too, as the country's import bill has soared thanks to the lower currency (which makes for more expensive imports).
The lack of domestic spending power is forcing companies to invest their money in exports. But the global export pie isn't growing much. That means Japan is having to take a greater piece of the pie. Greater market share, in other words.
Yet despite the lower yen, Japan isn't gaining share. Put simply, companies are selling more but at lower prices.
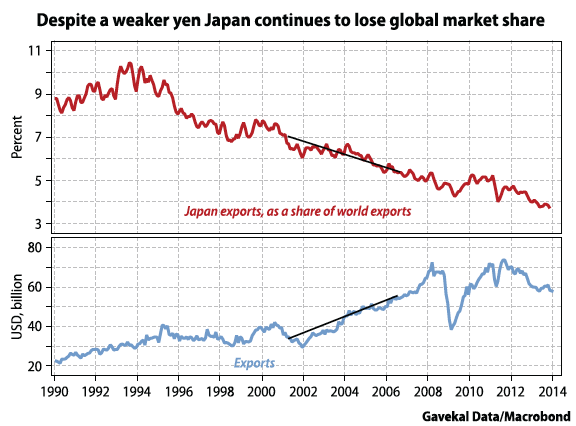
Many sell-side analysts point to the so-called J-curve effect, where the increase in exports after currency devaluation typically lags the rise in imports by 12-18 months. Thus they're suggesting a turnaround in Japanese fortunes is around the corner.
Others point out that imports temporarily spiked in anticipation of this month's consumption tax hike.
Both have these things may hold some truth. But the J-curve effect, in particular, is unlikely to prove a long-term solution to Japan's problems.
What's more likely is that you'll see more and more desperate actions to try to revive the economy. That could lead to a much lower yen. And that would put enormous pressure on other exporting powerhouses, such as China, South Korea and Germany. Tit-for-tat currency depreciations may result.
Of course, the great hope is that Japan will implement economic reforms to improve productivity, increase wages and lift domestic demand. Unfortunately, that's been the hope for the past 24 years and the forces opposing change have won at every turn.
In sum, a market crash as the Fed starts to lift interest rates seems an improbable scenario. Any crash would likely come from a deflationary bust instead. But any deflation will be met by even more stimulus which may serve to delay any economic bust.
The odds favour markets grinding higher for a while yet.
AC Speed Read
- A marginal pullback has led to a number of commentators suggesting a market crash is imminent.
- Henry Blodget is among the most prominent, calling for a potential S&P 500 market decline of up to 50% over the next 1-2 years.
- There are some flaws in his argument though, as Fed tightening is typically bullish for stocks, at least in the two years after an initial rate hike.
- Given a rate hike is likely to happen next year at the earliest, that means a more substantial market correction will have to wait to 2017, if history is any guide.
- The key risk to this scenario is a deflationary bust, precipitated by Japan and/or China.
