The buzz around (US) agricultural commodities has always been a matter of interest for a considerable amount of traders in the market.
If we look at the volume of trading on the agricultural market, we will see a significant difference between the classic commodities such as wheat, coffee or cocoa to the commodities which are considered to be more exotic such as cotton, or soybeans. Soybeans to be honest, raise a lot of interest among investors especially during this period of the year.
First I'll start with a little background on soybeans, for those of you who do not know - most of the production and export of soybeans is happening in the United States, Brazil, Argentina and Paraguay, while the biggest importer is (of course) China which is controlling over 50% of the market in question, followed by Europe, Central America, Japan and Taiwan.
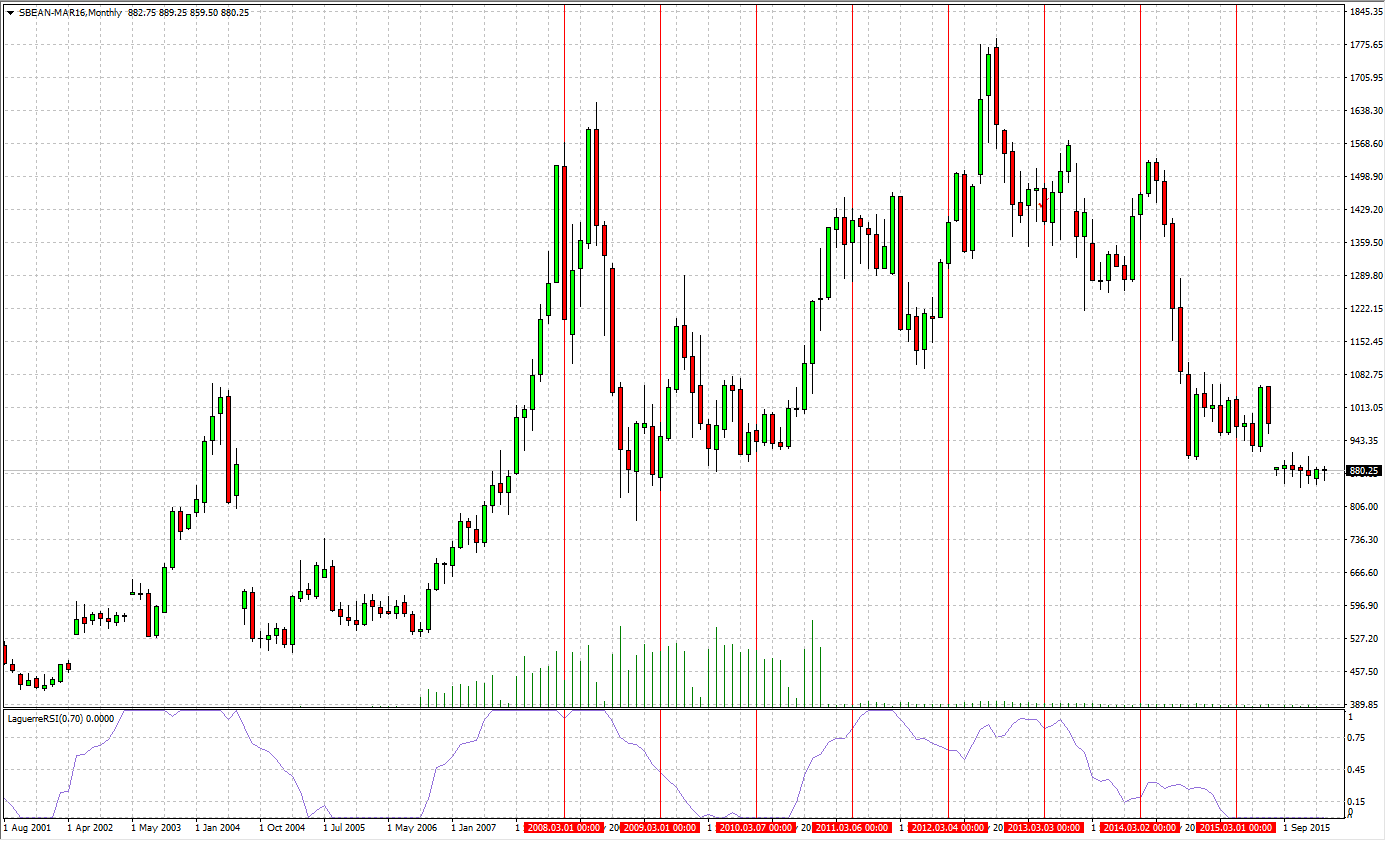
The price of soybeans hit its highest level ever seen during July 2012 when the price hit at $ 1,790/100 bushels. In the four years that have passed since the price declined consistently until it reached the current market price of the $ 880/100 bushels area.
Looking at the average prices for the last seven years it seems that the current market price hit a very strong support, which could indicate for a future bullish market, but is this really the case?
Soybean seeds are sown in spring (March-May) and harvested in the fall (September-October). During the time from planting to the harvest the grains are exposed to various weather conditions - temperatures, rainfall, wind and natural hazards, not to mention the various pests and so forth.
Which brings me to write about the upcoming planting next month.
Looking today at the monthly/weekly charts up to 7 years back, there is no regular pattern of increase or decrease in prices during the sowing.
Below, you can see the historical price movements during March-May in recent years.
2009 - Increase - $ 866 to $ 1,184 (+36.7%)
2010 - Decrease $ 965.5 to $ 937.5 (+3%)
2011 - Increase $ 1,360 - $ 1,378 (+1%)
2012 - Increase $ 1315.75 - $ 1340.75 (+2%)
2013 - Increase $ 1,473 - $1509.5 (+2.5%)
2014 - Increase $ 1,418 - $ 1,491 (+5%)
2015 - Decrease $ 1,029.75 - $ 972.75 (-5.5%)
While the above pattern doesn't tell me anything significant that can help me understand the market direction in the next few months, it appears that the overbought and oversold areas are very accurate when it comes to soybeans. Looking at the chart with the RSI Laguerre indicator (created by John F. Ehlers) it shows the extreme points perfectly synchronized with changes in trends.
Today, when applying the indicator on a monthly chart it indicates an abnormal extreme point (over sold) that tells us it is time to buy.
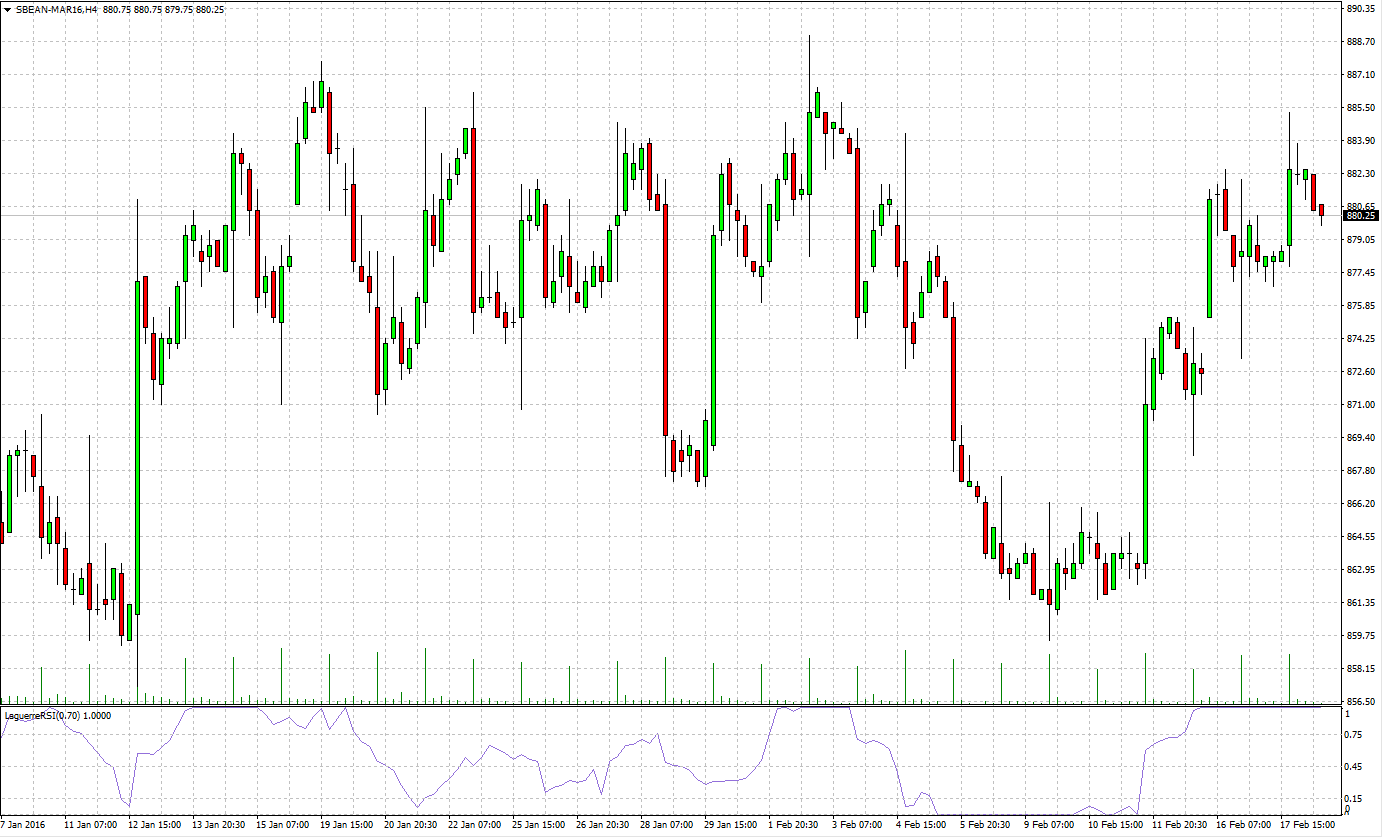
But when looking on the short-term chart it reports that the decline has not ended, yet. Therefore, before the start of trading on soybeans one needs to think about a strategy that combines both short-term and long-term trading.

In the short term: it is likely that the price will find an even lower support around $ 840 area. This process will probably take between 1 to 3 weeks. Then, you can expect a low volatility on price movement since the trading volume for the asset is not particularly high.
In the long term: during the weeks following the planting we would be able to begin watching the price increases. When the first target price will be around $ 890 (+5%) and the second target price would be around $ 1050 (+17%), i.e., closing the gap that was created on the price between 2015 and 2016.
