Investing.com’s stocks of the week
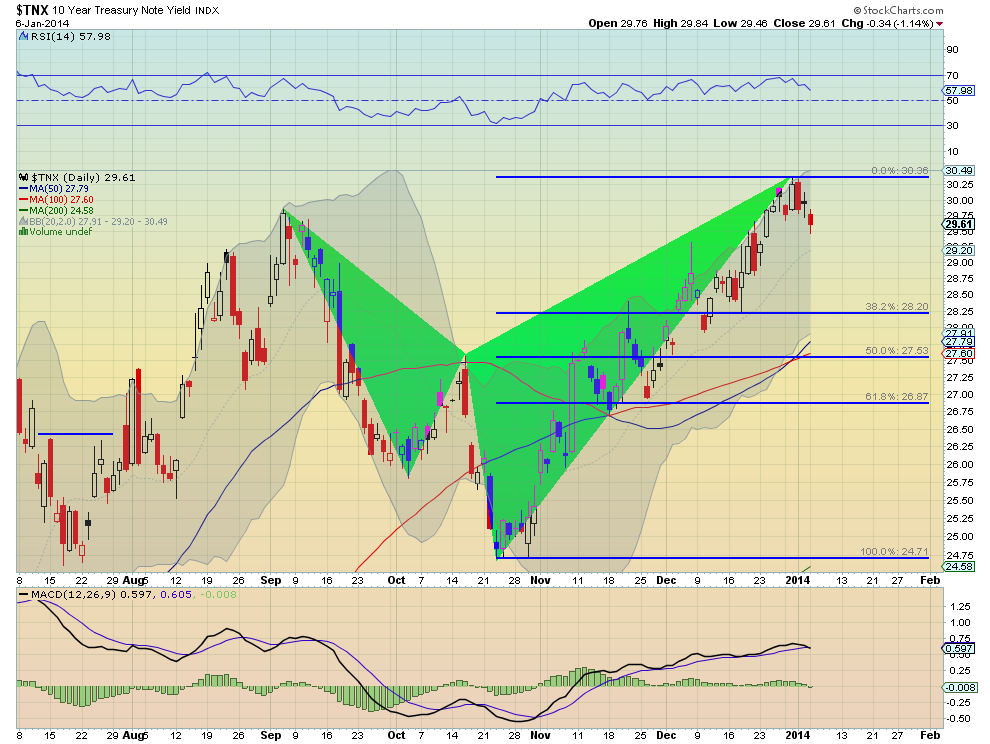
There was a major flow from Bonds into Stocks in 2013, and only 1 person (Bill Gross) expects that may reverse. But shorter rates, those on 5 and 10 year Treasuries, look ready for a reprieve, at least on a technical basis. The chart below of the 10 Year Treasury Note Yield (TNX) shows a big run higher since the bottom put in on October 23rd. But the price action has traced out a bearish Shark harmonic that touched its Potential Reversal Zone (PRZ) at 3.036% last week and is
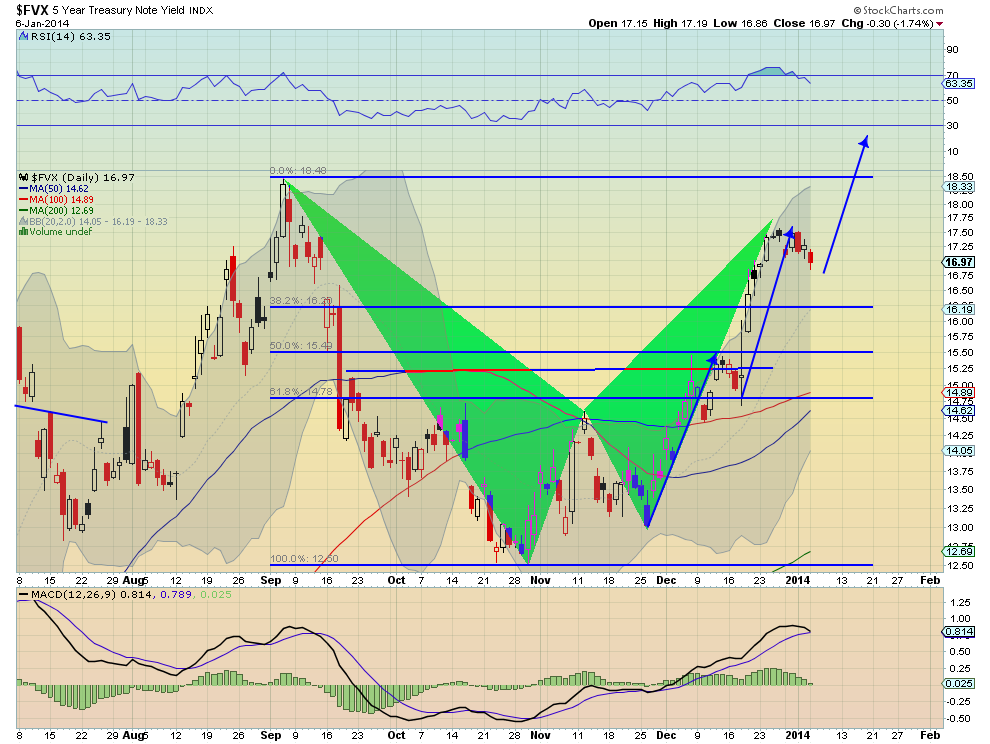
now reversing. The target for the pullback would be a move to 2.82 (a 38.2% retracement) or if it goes further, 2.687% (the 61.8% retracement). Anything less than that before a reversal back higher indicates a strong tendency for rates on the 10 year to rise. The 5 Year Treasury Note Yield chart looks similar. It has traced out a slightly different bearish Bat harmonic, and is pulling back. The initial target on this move would take it to 1.62% and the deeper target brings it all the way to 1.478%. But the two legs higher off of the November bottom suggest that a 3 Drives pattern could also take over on a failed retracement (again a show of a strong move higher in rates before reaching the 38.2% retracement level). This 
would look for a 25 basis point move higher off of the current forming low. The charts suggest that these shorter 5 and 10 Year rate moves have been overdone in the short term. But pay close attention to where they reverse to get more insight for the longer term.
Disclosure: The information in this blog post represents my own opinions and does not contain a recommendation for any particular security or investment. I or my affiliates may hold positions or other interests in securities mentioned in the Blog, please see my Disclaimer page for my full disclaimer.
Original post
