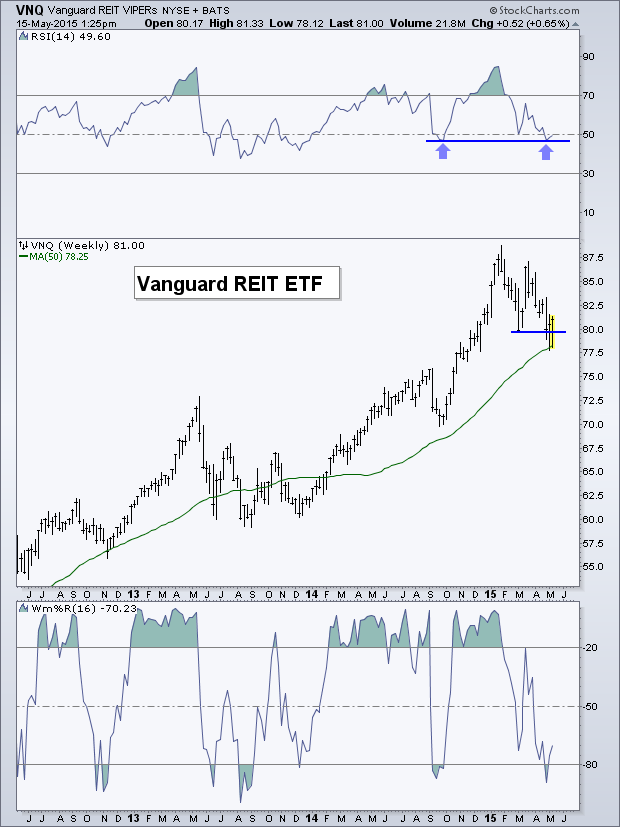
One set-up that stood out to me recently was the weekly chart of the Vanguard REIT ETF (ARCA:VNQ). While U.S. equities hit a fresh high last week, REITs are basically flat for 2015.
With the recent rise in U.S. interest rates, REITs have seen some rough patches over the past several weeks, because they have a low correlation to bond yields. In fact, the 60-week correlation between VNQ and the U.S. 10-Year Treasury yield is -0.94. I’d call that pretty negatively correlated! However, REITs have still outpaced long-term bonds with the ratio between VNQ and the iShares 20+ Year Treasury Bond (ARCA:TLT) sitting near its high from the past two years.
Below is a weekly chart of VNQ, going back to mid-2012. It’s had a nice up trend and is currently a little less than 10% off its high, which was set in 2014. While it began to show signs of a down trend, setting a lower high and then a lower low, price has bounced back and recovered the low from March. This bounce has occurred right at the 50-week Moving Average, which has helped ‘define’ the up trend over the last several years.
We are also seeing the previous low in the Relative Strength Index (RSI) also holding as support. This is a good sign that momentum may remain in a bullish range and price is in fact not about to start a new down trend. Another momentum tool that I don’t show very often, but I’ve included on this chart is the Williams %R. This indicator is essentially the inverse of the Stochastic Oscillator. It basically looks at price over a set period of time (16 weeks in this chart) and its position relative to the highest high over that same period. I find it interesting when the %R breaks below -80 on a weekly chart as it often has been associated with prior lows in price. We saw an example of this most recently last September and before that, December 2013.

If bond yields continue to come off their recent run, we could see the negative correlation to REITs work in REITs' favor as VNQ recovers and holds above its 50-week Moving Average. But if this slight drop in yield is just a pause and rates keep rising, then we may see REITs break this Moving Average support and their prior 2015 low.
Disclaimer: Do not construe anything written in this post or this blog in its entirety as a recommendation, research, or an offer to buy or sell any securities. Everything in this post is meant for educational and entertainment purposes only. I or my affiliates may hold positions in securities mentioned in the blog.
