Why Quantitative Easing Cannot Continue Indefinitely: There is only so Much of the National Debt Left
Since 2008, the Coal Mining Index (one of the Dow Jones Total Market Groups or DJTMG) has collapsed 96% as Federal regulations have nearly destroyed an industry which once employed tens of thousands and supported entire communities in one of the poorest regions of the United States: Appalachia.
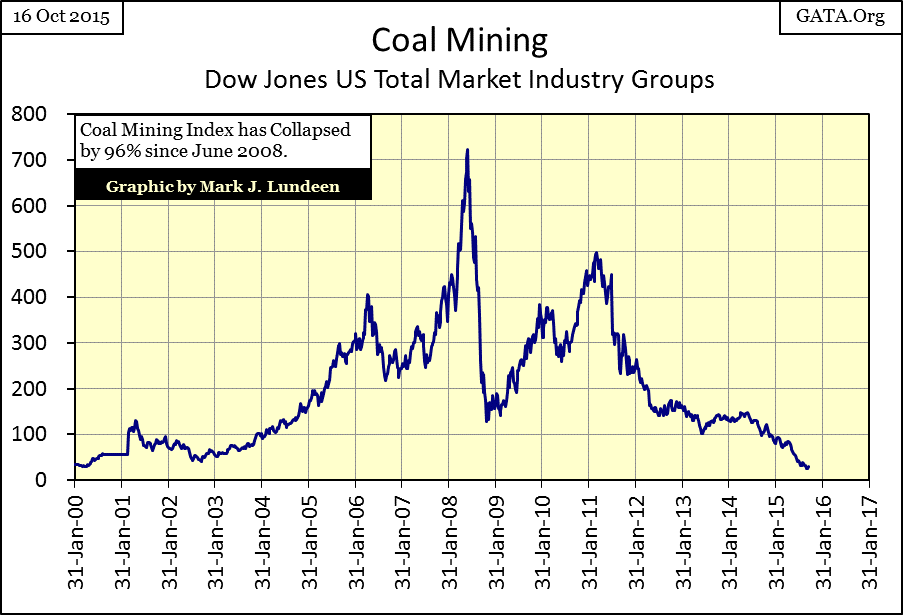
What the anti-capitalistic political culture now dominating “policy” and the media has already done to coal mining, it will ultimately do to the remainder of the economy, the financial system and the dollar. This is what the left has done ever since the French Revolution. When things finally fall apart, expect them to then blame their failures on Laissez-Faire Capitalism, which is an absurd notion in an economy as heavily regulated by government bureaucracies as America’s.
So, what progress have the “policy makers” made generating “economic growth?” The Obama Administration has grown the national debt by an additional eight trillion dollars since he first took office in 2009. And yes, in Keynesian Economic terms, increases in the national debt are a primary source of “economic growth,” which is why central banks the world over continue to “monetize” US Treasury Debt: to “stimulate” and “stabilize” their economies with monetary inflation.
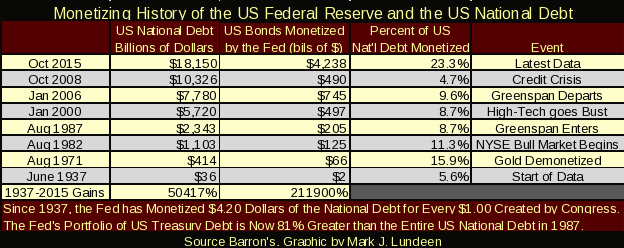
But as is apparent below, since 2008 foreign CB’s (Blue Plot) have lost their appetite for Uncle Sam’s IOUs, forcing the Federal Reserve to pick up the slack in the bond market to “stabilize” the American economy and keep bond yields low.
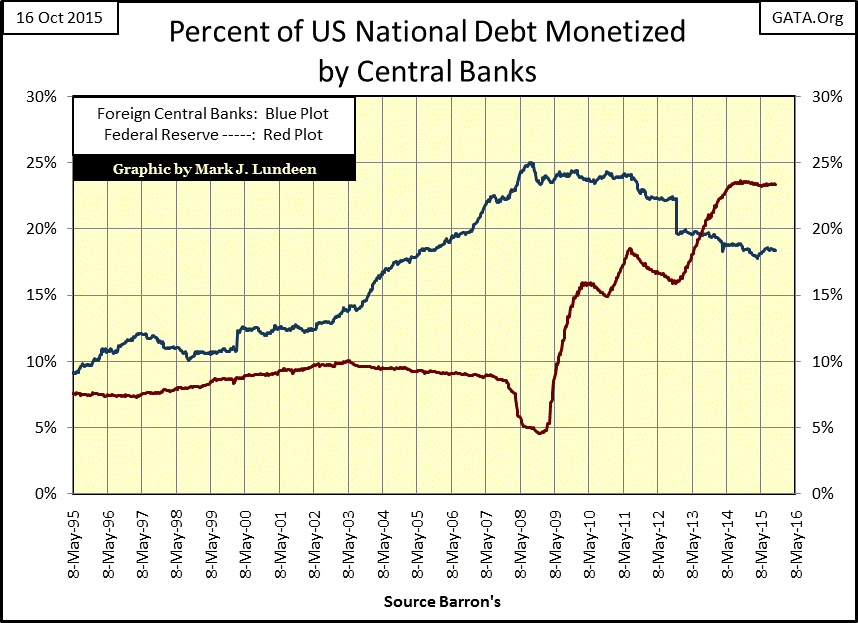
Keep in mind the chart above is plotted in percentages of the US National Debt. So, though it appears that foreign CBs are selling off their US Treasury debt, in fact their T-debt holdings have been remarkably stable since 2008, unlike the growth in the National debt, which has skyrocketed, as seen below. Also note that banks (foreign and domestic) have now monetized the entire national debt as it stood in October 2008.
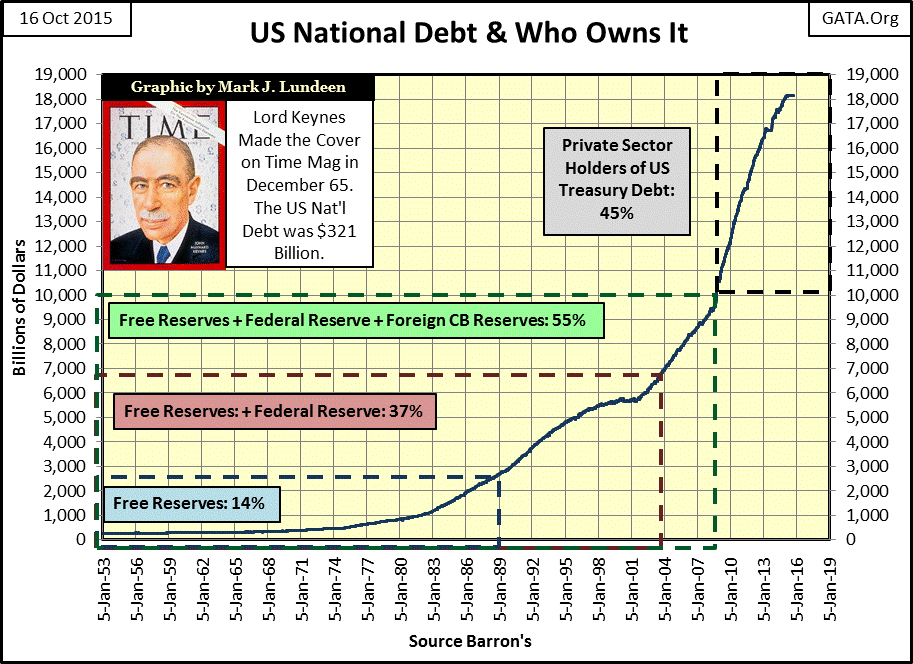
Had the Federal Government abandoned its policy of deficit spending in 2009, (preventing the addition of eight trillion dollars to the national debt over the past six years), the entire national debt would now be “monetized” by the global banking system.
What exactly does this mean, to have monetized the entire national debt? It basically means that there would be zero dollars of US Treasury bonds owned by the general public and 100% of outstanding treasury bonds owned by central banks.
It does not mean that the national debt has been paid off, just that its ownership has been transferred to private banks, which use monetary inflation to purchase these bonds. So what’s to prevent endless government borrowing (our current fiscal policy), and endless transfer of the nation’s debt onto the Fed’s balance sheet? Nothing at all! And what would the consequences of such a policy be?
We are already seeing the consequences in the loss of 98% of the dollar’s purchasing power since the creation of the Fed, and all levels of society deeply indebted to the banking system. I find it distressing the Fed’s balance sheet has increased from $800 billion to $4.5 trillion under Obama’s tenure, but most people have not even noticed this. Even if you pointed it out, they would not begin to understand how it affects them personally – but one day they will.
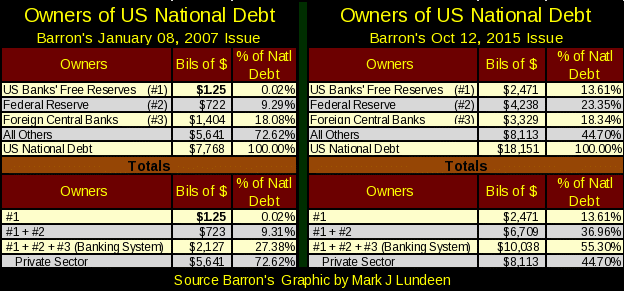
The table below breaks down who owns the US National debt as of Barron’s 08 January 2007 issue and again nine years later in its 12 October 2015 issue. FYI: the chart above is based on Barron’s data for October 2015; right side, lower section of the table below.
Even as of January 2007, when they had monetized just 9.29% of the $7.77 trillion dollar national debt, I had nothing positive to say about the Federal Reserve. Then the credit crisis came. Over just the past eight years Washington has expanded the National debt by an additional eleven trillion dollars, while the Federal Reserve monetized 23% of the nation’s debt to bailout its “favored financial institutions.”
(When asked directly during congressional testimony if the Federal Reserve would monetize U.S. government debt, the Fed Chairman responded) "The Federal Reserve will not monetize the debt."
- Doctor Benjamin Bernanke: June 03, 2009
The chart and table above are not in the least bit ambiguous. Like all members of the FOMC, Doctor Bernanke routinely lied to Congress on the state of the economy and the activities of the FOMC. The media still sources “financial news” based on the opinions of Alan Greenspan, Doctor Bernanke and Janet Yellen; opinions the media never challenge. This speaks volumesabout their culpability for our present situation.
Currently there is much speculation that the Federal Reserve will be forced to implement a fourth QE in the near future. However, the graphics above illustrate there isn’t much left of the national debt to “monetize.” Is the remaining eight trillion dollars held by the private sector sufficient for a proper QE? And what happens when it’s made public that banks have “monetized” over 80% of America’s national debt?
The US dollar in the hands of the Federal Reserve is doomed. As the table below shows, the Fed’s current portfolio of US Treasury bonds is now 81% larger than the entire US national debt when Alan Greenspan took over as Fed Chairman in August 1987.
The Federal Reserve has monetized $4.20 of national debt for each $1.00 of additional debt created by Congress since 1937. This is clearly unsustainable. It’s truly frightening that Ph.Ds. in Economics from esteemed Ivy League Universities are the ones supervising these monetary and fiscal shenanigans.
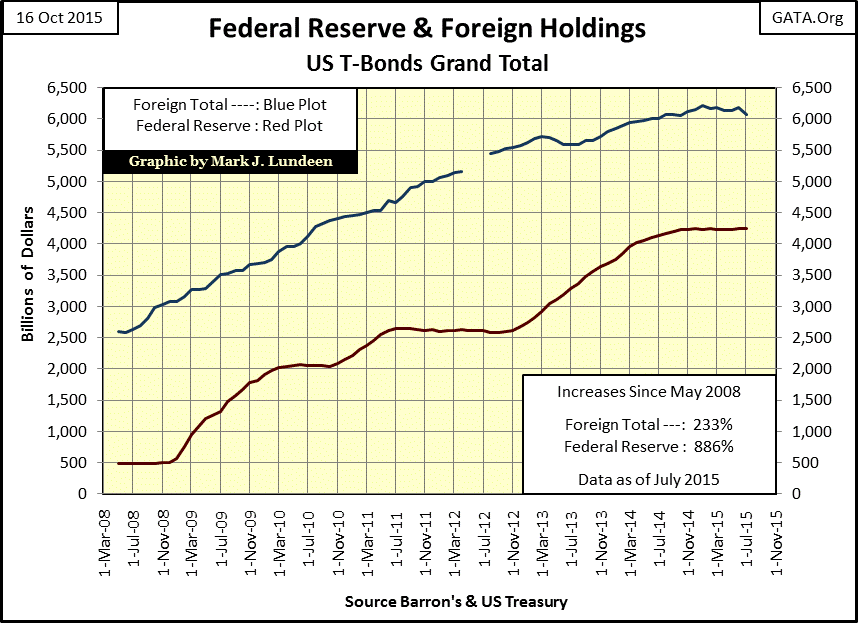
The US Treasury also publishes data on foreign holdings of US Treasury debt (Blue Plot below). In aggregate foreign holders of T-bonds aren’t selling their T-bonds, if you can believe this data from the US Treasury. However for the past nineteen months, the world hasn’t been buying anymore of what the US Treasury is selling.
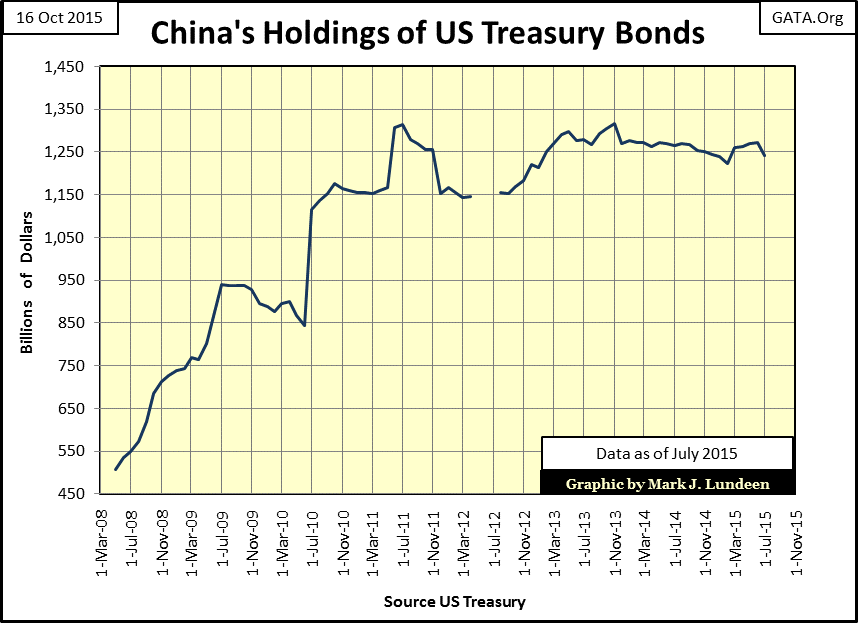
Lets look at China’s holdings of US T-debt. Their portfolio of America’s national debt peaked in June 2011 and as of July 2015 (latest publicly available data from the Treasury) haven’t begun to liquidate their T-debt. But then I’ve also seen stories where China's foreign-exchange reserves plunged by a record $94 billion in August. I’ll have to wait until the Treasury publishes its data for August before I know what is happening.
But China will sell these bonds someday for the simple reason that they purchased these bonds for investment purposes. China is no different than any other investor, so I expect the day is coming when they will sell these bonds to either lock in a profit, cut their losses or raise cash to pay their bills. When that day comes, I expect the US “financial media” to frame any decision by the Chinese to sell these bonds as part of a global strategy to weaken or manipulate the US Government; which is possible. But with China holding $1.24 trillion dollars of the US national debt, it could be an expensive game of political poker for the Chinese to play.
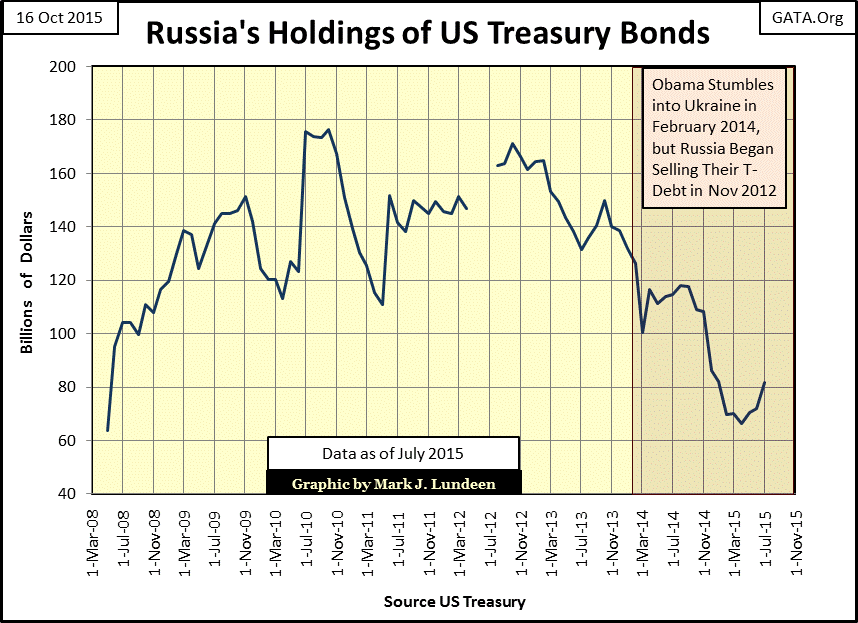
Russia’s holdings of the American national debt are shown below. Do not believe that Russia’s current reduction in their T-debt holdings is in reaction to Washington’s meddling in Ukraine since February 2014; as the decline actually began in October 2012. But back in 2012, Hillary Clinton was Obama’s Secretary of State, so I won’t rule out the current decline in the Russian portfolio of T-debt as a result of American foreign policy incompetence. It’s more likely, however, that Russia is selling off their T-debt in order to fund purchases of gold bullion, which would be a prudent move on their part, or anyone else who has taken the time to study inflationary situation the dollar now finds itself in.
Next is a table comparing current foreign holders of Treasury debt to historical extremes going back to May 2008. The table is sorted by its Jul-15 column (largest to smallest) and is broken up into two sections:
Billions of Dollars
Percent From
The dollar section shows the most recent data (July 2015), along with the countries maximum and minimum holdings of US Treasury debt since May 2008. The percentage section shows the percentage change between the July 2015 data and the two historical extremes. The Grand Total (#1) does not include the Data from the Federal Reserve (#2).
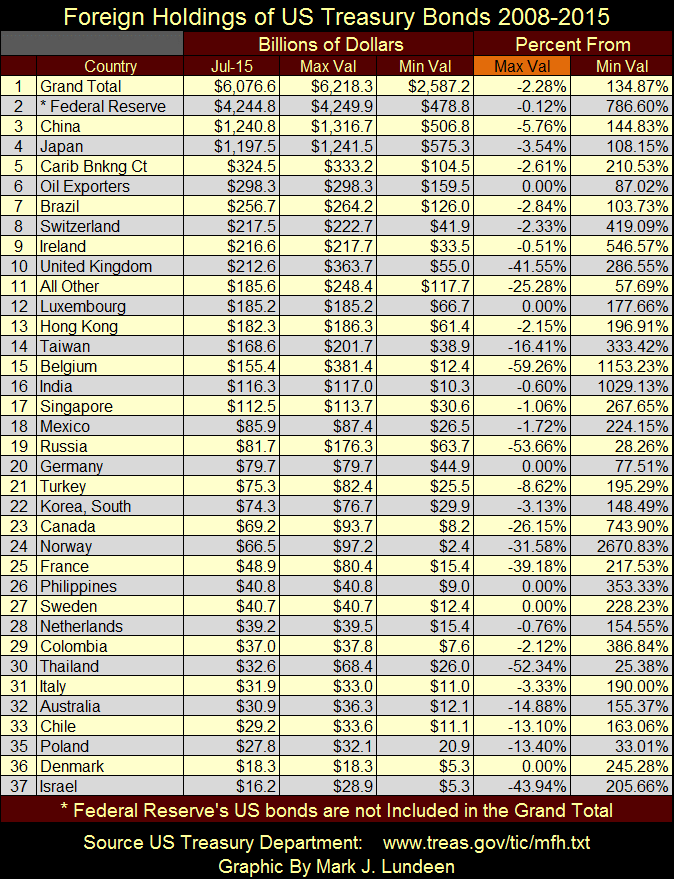
Using China’s and Russia’s charts above, with their data in the table (#3 and #19), you’ll see the insight this graphic provides. The Percent From / Min Val column tells us that the world has invested much of their savings in Washington’s dubious IOUs since May of 2008. This data also tells us that after the credit crisis the world has not deleveraged, instead it has gone deeper into debt.
The Percent From / Max Val column (Orange Tab) shows us that the world (as of July 2015) hasn’t yet begun any wholesale liquidation of US Treasury debt. In fact, a 0.00% in this column indicates a country that has increased their T-debt holdings to a new all-time high. Five countries had done exactly this in July 2015. But with the current state of affairs on Wall Street and in Washington, I expect we’ll soon be seeing more countries with large double-digit percentage declines in their holdings of US Treasury debt.
Will the Federal Reserve be willing to “monetize” a large portion of this six-trillion dollars of Treasury debt should foreigners decide to sell it? If “policy” demands that US interest rates remain low it will have to. That won’t be good for the financial markets, but it will be for gold and silver.
