
A month has gone by since the last earnings report for Wynn Resorts, Limited (NASDAQ:WYNN) . Shares have lost about 15.4% in that time frame, underperforming the market.
Will the recent negative trend continue leading up to its next earnings release, or is WYNN due for a breakout? Before we dive into how investors and analysts have reacted of late, let's take a quick look at its most recent earnings report in order to get a better handle on the important drivers.
Wynn ResortsTops Q4 Earnings & Revenue Estimates
Wynn Resorts posted better-than-expected results for fourth-quarter 2017.
Adjusted earnings of $1.40 per share surpassed the Zacks Consensus Estimate of $1.36 by nearly 2.9%. Earnings increased more than 100% from the year-ago figure of 50 cents, given a substantial increase in operating income from Macau operations (Wynn Palace and Wynn Macau) and income tax benefit from U.S. tax reform, partially offset by a decrease in Redemption Note fair value.
Wynn Resorts’ revenues of $1.69 billion beat the Zacks Consensus Estimate of $1.54 billion by 9.7%. Revenues increased 29.9%, given significant contribution from Wynn Palace and Wynn Macau.
Wynn Macau Revenues Up Year Over Year
Wynn Macau revenues increased 24.1% year over year to $618.6 million in the quarter, owing to higher casino as well as non-casino revenues. Notably, casino revenues jumped 25.3% to $582.9 million. Meanwhile, table games turnover in the VIP segment rose a massive 44.7% to $15.62 billion. In addition, the VIP table games win rate (based on turnover) was 2.89%, down 19 basis points (bps) year over year and within the projected range of 2.7% to 3%.
Table drop in the mass market segment was $1.25 billion, up 14.1% year over year. Table games win in the mass market category amounted to $230.1 million, up 18.6%. Table games win percentage in mass market operations was 18.4%, up 70 bps from the year-ago quarter.
Non-casino revenues before promotional allowances increased 14.5% to $73.9 million. Room revenues were flat year over year at $25.9 million. Revenue per available room (RevPAR) increased 2% in the quarter to $257 million. Average daily rate (ADR) declined 1.5%. Conversely, occupancy rate increased 310 bps to 97.3%.
Wynn Palace Treads the Growth As Well
Revenues from Wynn Palace were $693.4 million in the quarter, up a massive 65.6% year over year. Casino revenues totaled $648.6 million, increasing 73.8%. Table games turnover in the VIP segment was $16.23 billion, up 57.1%. VIP table games win rate (based on turnover) was 3.02% above the expected range of 2.7-3% and up 34 bps year over year. Markedly, table drop in the mass market segment was $1.12 billion, surging 55.1% from the year-ago quarter. While table games win in mass market operations amounted to $264.5 million, increasing 65.7%, mass market win rate increased 150 bps to 23.5%.
Non-casino revenues, before promotional allowances were $90.8 million, up 5.5% from the year-ago quarter. During the quarter, room revenues were $38.9 million, up 4.1% from the year-ago figure. Notably, ADR came in at $236 million (down 13.2%), occupancy was 96.8% (up 840 bps) and RevPAR was $228 million (down 5.4%).
Las Vegas Operations Weak
Revenues from Las Vegas operations decreased 1.6% year over year to $377 million in the quarter, owing to lower casino and non-casino revenues. Notably, casino revenues fell 14.1% to $142.7 million. Table games drop and table games win decreased 4.8% and 18.6%, respectively.Table games win percentage of 23.5% declined 400 bps from the year-ago quarter and was within the expected range of 21% to 25%.
However, total non-casino revenues, before promotional allowances increased 5.8% year over year to $275.2 million. Room revenues were up 1.9% to $107.8 million. During the quarter, RevPAR grew 2% to $250 million on the back of a 4.8% increase in ADR. Occupancy rate was 82.1% compared with 84.1% in the year-ago quarter. Food and beverage revenues increased 9.9% to $108 million, and entertainment, retail and other revenues were up 5.8% to $59.5 million.
Operating Performance Strong at Wynn Macau and Wynn Palace
Adjusted property earnings before interests, taxes, depreciation and amortization (EBITDA) surged 40.9% year over year to $480.2 million, driven by increases at Wynn Macau and Wynn Palace, partially offset by a decline in Las Vegas.
In the quarter, adjusted property EBITDA from Wynn Macau was $186 million, up 25% year over year, while that from Wynn Palace surged more than 100% to $190.1 million. Adjusted property EBITDA from Las Vegas operations was down 9.2% to $104.1 million.
Net Income Rises on Solid Operating Performance
Adjusted net income came in at $144.3 million, up from $50.8 million in the year-ago quarter. The surge was mainly driven by increase in operating income from Wynn Palace and Wynn Macau and income tax benefit from U.S. tax reform, partially offset by a decrease in Redemption Note fair value
Cash Position Down Slightly
As of Dec 31, 2017, Wynn Resorts’ cash and cash equivalents, restricted cash and investment securities were $3.13 billion compared with $3.26 billion as of Sep 30, 2017.
Outstanding debt at the end of the quarter totaled $9.63 billion, including $3.16 billion of Wynn Las Vegas related debt, $3.60 billion of Macau debt, and $2.87 billion at the parent company and other.
During the quarter, Wynn Macau redeemed the remaining $403.6 million of untendered 5 1/4 % Senior Notes due 2021 and recorded a $12.3 million loss on extinguishment of debt.
How Have Estimates Been Moving Since Then?
In the past month, investors have witnessed a downward trend in fresh estimates. There has been one revision higher for the current quarter compared to two lower.
Wynn Resorts, Limited Price and Consensus
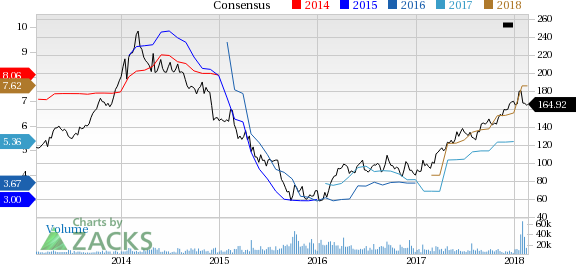
Wynn Resorts, Limited Price and Consensus | Wynn Resorts, Limited Quote
VGM Scores
At this time, WYNN has a great Growth Score of A, a grade with the same score on the momentum front. However, the stock was allocated a grade of C on the value side, putting it in the middle 20% for this investment strategy.
Overall, the stock has an aggregate VGM Score of A. If you aren't focused on one strategy, this score is the one you should be interested in.
Based on our scores, the stock is equally suitable for growth and momentum investors.
Outlook
Though estimates have been broadly trending downward for the stock, the magnitude of these revisions indicates an upward shift. Interestingly, WYNN has a Zacks Rank #3 (Hold). We expect in-line returns from the stock in the next few months.
Wynn Resorts, Limited (WYNN): Free Stock Analysis Report
Original post
Zacks Investment Research