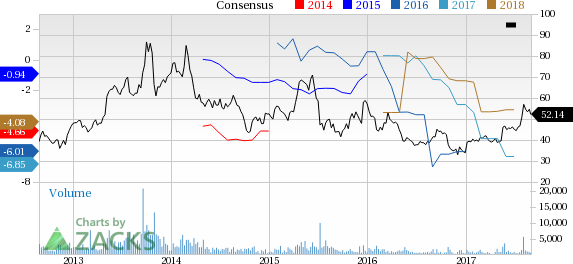
A month has gone by since the last earnings report for Sohu.com Inc. (NASDAQ:SOHU) . Shares have lost about 8.9% in that time frame, underperforming the market.
Will the recent negative trend continue leading up to the stock's next earnings release, or is it due for a breakout? Before we dive into how investors and analysts have reacted as of late, let's take a quick look at its most recent earnings report in order to get a better handle on the important catalysts.
Recent Earnings
Sohu.com reported results for second-quarter 2017. While the top line recorded a significant year-over-year improvement, the bottom line didn’t fare well when compared with the year-ago quarter.
The company reported non-GAAP loss of $1.85 per share, which was wider than the year-ago quarter’s loss of $1.62. Adjusted loss per share (excluding all one-time items but including stock-based compensation) was $2.17. The Zacks Consensus Estimate was pegged at a loss of $1.73 per share.
Sohu’s revenues of $461.2 million beat the Zacks Consensus Estimate of $413 million. Revenues were up 9.8% year over year and 23.3% on a sequential basis.
The robust growth was mainly driven by solid performance of the Legacy TLBB mobile game, which it launched in mid-May, along with continued strong growth momentum witnessed at the mobile search. This was partially offset by depreciation of RMB against major currencies.
Quarter Details
Total online advertising revenues (inclusive of revenues from brand advertising, search and search related businesses) fell marginally year over year to $272.8 million from $273 million in the year-ago quarter.
Brand advertising revenues in the reported quarter fell 23.8% to $86.1 million on a year-over-year mainly due to weak video and ad sales.
Search and search-related revenues increased 16.6% to $186.7 million on 24% growth in search traffic. Notably, mobile traffic grew over 50% during the quarter.
Online game revenues were up 23.3% from the year-ago quarter mainly on strong performance of the newly launched Legacy TLBB mobile game.
Sogou’s revenues grew 20% year over year and 30% from the previous quarter to $211 million, driven by increase in mobile and search traffic.
Margins
Non-GAAP gross margin in the quarter decreased to 40% from 49% in the year-ago quarter. Non-GAAP gross margin of the company’s online advertising business was 19%, down from 39% in the prior-year quarter.
Brand advertising business margin was negative 45%, reflecting a sharp drop from 17% reported in the year-ago quarter primarily due to higher video content cost.
Non-GAAP gross margin for the search and search-related business in the quarter was 48%, down from 55% in the year-ago quarter. Higher traffic acquisition cost was one of the major reasons for declining margins.
Non-GAAP gross margin of the company’s online game business was 91% compared with 74% reported in the prior-year quarter. The successful launch and accelerated adoption of the online Legacy TLBB game was a key growth factor driving margin.
Sohu’s non-GAAP operating loss was $27 million compared with a loss of $26 million in the year-ago quarter.
GAAP loss per share was $2.28, significantly wider than the year-ago quarter’s loss of $1.64.
Balance Sheet
Sohu exited the quarter with cash and cash equivalents (and short-term investments) of $1.24 billion compared with $1.25 billion as of Mar 31, 2017.
Outlook
For the third quarter of 2017, Sohu expects revenues in the range of $480–$510 million.
Management estimates brand advertising revenues in the range of $70 million to $80 million, representing 28% to 37% year-over-year decline.
Sogou revenues are expected in the range of $230 million to $240 million, representing 39% to 45% year-over-year increase. Online game revenues are expected in the band of $120–$130 million, hinting at a year-over-year decline of 22% to 32%.
The company expects non-GAAP loss per share between $1.00 and $1.25.
Sogou to File for IPO
Concurrent with its second-quarter results, Sohu announced that it intends to file for an IPO of American depositary shares (ADS) for its subsidiary, Sogou with the U.S. Securities and Exchange Commission (SEC). However, the exact number of ADS to be offered has not been determined.
How Have Estimates Been Moving Since Then?
Analysts were quiet during the past month as none of them issued any earnings estimate revisions.
VGM Scores
Currently, Sohu.com's stock has a subpar Growth Score of D, a grade with the same score on the momentum front. Charting a somewhat similar path, the stock was allocated a grade of C on the value side, putting it in the middle 20% for this investment strategy.
Overall, the stock has an aggregate VGM Score of D. If you aren't focused on one strategy, this score is the one you should be interested in.
The company's stock is suitable solely for value based on our styles scores.
Outlook
The stock has a Zacks Rank #3 (Hold). We are looking for an inline return from the stock in the next few months.
Sohu.com Inc. (SOHU): Free Stock Analysis Report
Original post
Zacks Investment Research

