
It has been about a month since the last earnings report for SLM Corporation (NASDAQ:SLM) . Shares have lost about 16.5% in that time frame, underperforming the market.
Will the recent negative trend continue leading up to the stock's next earnings release, or is it due for a breakout? Before we dive into how investors and analysts have reacted as of late, let's take a quick look at the most recent earnings report in order to get a better handle on the important drivers.
Sallie Mae Q1 Earnings Beat Despite Higher Costs
Sallie Mae reported first-quarter 2017 core earnings of $0.21 per share, easily beating the Zacks Consensus Estimate of $0.15. Also, the bottom line increased 43% from the prior-year quarter.
Better-than-expected results were primarily driven by an increase in net interest income. Continued rise in private education loan originations and lower provisions were the tailwinds. However, these positives were offset by lower non-interest income and higher expenses.
Sallie Mae reported core earnings (primarily adjusting for derivatives) attributable to the company's common stock, of $92.7 million, up 51% from the year-ago quarter.
Higher Expenses Partially Offset Net Interest Income Growth
Net interest income for the first quarter was $268.1 million, up 28% year over year. The rise was mainly driven by an increase in the portfolio size of private education loans. Net interest margin expanded 19 basis points (bps) year over year to 5.96%.
Non-interest income came in at $6 million, significantly down from $20.7 million in the prior-year quarter, primarily reflecting loss on derivatives and hedging activities and lower other income recorded in the reported quarter.
The company’s total expenses were up 11% year over year to $102.8 million. The rise in expenses was mainly due to increased compensation and benefits expenses, higher FDIC assessment fees and other expenses.
Efficiency ratio, on a non-GAAP basis, declined to 36.8% in the quarter from 40.2% in the year-ago quarter. A lower ratio indicates improved profitability.
Provision for loan losses was $25.3 million, down 22% year over year.
As of Mar 31, 2017, the private education loan portfolio was $15.5 billion, up 29% year over year. Notably, loan origination climbed 2% year over year to $1.8 billion in the reported quarter.
Average yield on the loan portfolio was 8.26%, up 23 bps year over year. Delinquencies as a percentage of private education loans in repayment were 1.9%, down from 2.1%.
Deposits Rise
As of Mar 31, 2017, deposits of Sallie Mae Bank were $13.4 billion, up from $11.5 billion as of Mar 31, 2016. Increases in broker deposits along with retail and other deposits contributed to the rise.
Strong Capital Position
As of Mar 31, 2017, Sallie Mae Bank’s Tier 1 capital to risk-weighted assets and common equity Tier 1 capital were both 12.3%. Capital ratios exceeded the “well capitalized” industry benchmark in regulatory requirements.
2017 Outlook
The company estimates core earnings per share in the range of $0.70–$0.72 for this year.
The operating efficiency ratio on a non-GAAP basis is expected to be 38-39%.
The company expects the NIM to be higher than that of 2016.
Management expects total risk based capital to be in mid-12% range in 2017.
How Have Estimates Been Moving Since Then?
Following the release, investors have witnessed an upward trend in fresh estimates. There has been one revision higher for the current quarter.
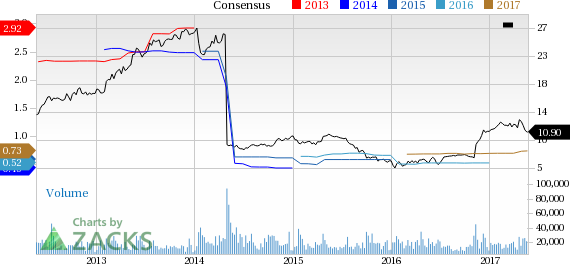
SLM Corporation Price and Consensus
VGM Scores
At this time, the stock has a poor Growth Score of 'F', however its momentum is doing a lot better with a 'C'. However, the stock was allocated a grade of 'D' on the value side, putting it in the bottom 40% for this investment strategy.
Overall, the stock has an aggregate VGM Score of 'F'. If you aren't focused on one strategy, this score is the one you should be interested in.
The company's stock is suitable solely for momentum based on our styles scores.
Outlook
While estimates have been moving upward, the magnitude of the revision is net zero. Notably, the stock has a Zacks Rank #2 (Buy). We are expecting an above average return from the stock in the next few months.
SLM Corporation (SLM): Free Stock Analysis Report
Original post
Zacks Investment Research