
A month has gone by since the last earnings report for Prosperity Bancshares, Inc. (NYSE:PB) . Shares have lost about 1.3% in the past month, outperforming the market.
Will the recent negative trend continue leading up to its next earnings release, or is PB due for a breakout? Before we dive into how investors and analysts have reacted as of late, let's take a quick look at its most recent earnings report in order to get a better handle on the important drivers.
Prosperity Bancshares Misses Q4 Earnings & Revenue Estimates
Prosperity Bancshares’ fourth-quarter 2017 adjusted earnings of 99 cents per share for the quarter lagged the Zacks Consensus Estimate by a penny. The figure was in line with the prior-year quarter’s earnings.
Results were hurt by an increase in expenses and lower non-interest income along with continued margin pressure. However, higher net interest income and improving loan and deposit balances were on the positive side.
After taking into consideration a one-time non-cash charge of 2 cents per share relating to the Tax Act, net income for the quarter came in at $67.1 million or 97 cents per share.
For 2017, net income was $272.2 million or $3.92 per share, down from $274.5 million or $3.94 per share registered in 2016.
Net Interest Income Improve, Expenses Rise
Net revenues of $185.3 million for the reported quarter marginally lagged the Zacks Consensus Estimate of $185.4 million. However, the figure increased 1.1% from the prior-year quarter.
Net revenues for 2017 were $733.5 million, decreasing 2.3% from the prior year. Also, the figure lagged the Zacks Consensus Estimate of $738 million.
Net interest income was $156.1 million for the quarter, increasing 1.4% year over year. The rise was primarily due to an increase in average balance and yield on interest-earning assets, partially offset by an increase in the average rate on interest-bearing liabilities.
However, net interest margin, on a tax equivalent basis, decreased 6 basis points (bps) to 3.20%.
Non-interest income declined nearly 1% year over year to $29.2 million. This fall was primarily due to lower mortgage income, brokerage income and net gain on sale of assets.
Non-interest expenses increased 2.5% year over year to $81.1 million. The company witnessed net loss on sale or write-down of other real assets in the quarter against net gain recognized in the prior-year period, which mainly led to the rise in expenses.
Loans & Deposits Increase
As of Dec 31, 2017, total loans were $10 billion, up 1.1% from the prior quarter. Total deposits increased 5.4% from the previous quarter to $17.8 billion.
Credit Quality: A Mixed Bag
As of Dec 31, 2017, total nonperforming assets were $37.5 million, decreasing 22.5% year over year. Also, the ratio of allowance for credit losses to total loans was down 5 bps year over year to 0.84%.
Notably, provision for credit losses remained stable at $2 million compared with the prior-year quarter. However, net charge-offs totaled $4.7 million, significantly up from the year-ago quarter figure of $2.3 million.
Capital Ratios Strengthen, Profitability Ratios Deteriorate
As of Dec 31, 2017, Tier-1 risk-based capital ratio came in at 15.08% compared with 14.48% as of Dec 31, 2016. Moreover, total risk-based capital ratio was 15.74%, up from 15.20% at the end of the year-ago quarter.
Also, common equity tier 1 capital ratio was 15.08%, up from 14.48% in the prior-year quarter.
The annualized return on average assets was 1.20%, down from 1.26% in the prior-year quarter. Similarly, annualized return on common equity was 7.04% compared with 7.58% in the prior-year quarter.
Outlook
Management expects organic loan growth to be in about 5-6% in 2018. Also it expects deposits to grow around 3-4% in 2018.
Going forward, management expects loan discount accretion to be in the range of $2-$2.5 million on a quarterly basis.
Management expects core margin to remain relatively stable in the coming quarters.
Management expects non-interest expenses to be around $81 million per quarter, going forward.
The company expects effective tax to be around 21% in 2018.
How Have Estimates Been Moving Since Then?
In the past month, investors have witnessed an upward trend in fresh estimates. There have been two revisions higher for the current quarter compared to one lower. While looking back an additional 30 days, we can see even more upward momentum.
Prosperity Bancshares, Inc. Price and Consensus
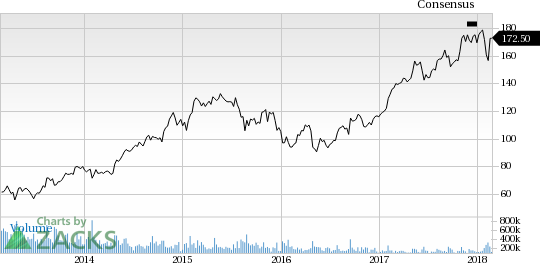
Prosperity Bancshares, Inc. Price and Consensus | Prosperity Bancshares, Inc. Quote
VGM Scores
At this time, PB has a poor Growth Score of F, however its momentum is doing a lot better with a B. Following the exact same course, the stock was also allocated a grade of B on the value side, putting it in the top 40% for this investment strategy.
Overall, the stock has an aggregate VGM Score of C. If you aren't focused on one strategy, this score is the one you should be interested in.
Zacks' style scores indicate that the company's stock is suitable for value and momentum investors.
Outlook
Estimates have been broadly trending upward for the stock, and the magnitude of these revisions looks promising. Interestingly, PB has a Zacks Rank #3 (Hold). We expect an in-line return from the stock in the next few months.
Prosperity Bancshares, Inc. (PB): Free Stock Analysis Report
Original post
Zacks Investment Research