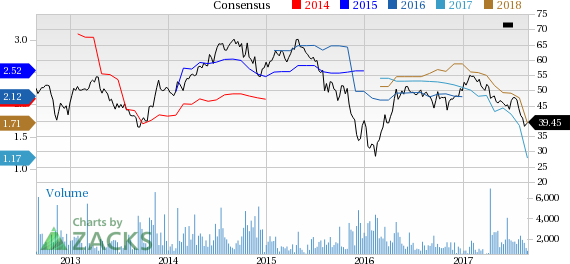
About a month has gone by since the last earnings report for Nustar Energy L.P. (NYSE:NS) . Shares have lost about 11.1% in that time frame, underperforming the market.
Will the recent negative trend continue leading up to the stock's next earnings release, or is it due for a breakout? Before we dive into how investors and analysts have reacted as of late, let's take a quick look at its most recent earnings report in order to get a better handle on the important drivers.
Second-Quarter 2017 Results
NuStar Energy reported second-quarter earnings per limited partner unit of $0.05, way off the Zacks Consensus Estimate of $0.33 and the year-ago quarter profit of $0.52.
The owner and operator of crude oil and refined products pipelines and storage facilities’ bottom line suffered due to a light quarter from the ‘Pipeline’ and ‘Fuels marketing’ businesses.
Quarterly revenues of $435.5 million missed the Zacks Consensus Estimate of $520 million and was also below the year-ago level of $437.8 million.
Quarterly Distribution
NuStar announced a quarterly distribution of $1.095 per unit ($4.38 per unit annualized) that remains unchanged from the year-earlier as well as previous-quarter distributions. The distribution is payable on Aug 11 to unitholders of record as on Aug 7, 2017.
As per NuStar’s earnings release, distributable cash flow (DCF) available to limited partners for the second quarter was $60.3 million (providing 0.59x distribution coverage), compared with $92.8 million (providing 1.09x distribution coverage).
Segmental Performance
Pipeline: Total quarterly throughput volumes in the segment were 1,089,711 barrels per day (Bbl/d), up 16% from the year-ago period. While throughput volumes in the crude oil pipelines jumped 40% from the year-ago quarter to 558,182 Bbl/d, refined product pipelines throughput edged down 1% to 531,529 Bbl/d. As a result, throughput revenues rose 4% year-over-year to $126.7 million.
However, the segment’s operating income – at $52.9 million – was down 17% from the year-ago figure of $63.6 million, primarily due to the effects of turnaround and operational issue at some of NuStar’s customer refineries.
Storage: Throughput volumes in the Storage segment plunged 54% year over year to 337,518 Bbl/d. Nevertheless, higher renewal storage rates, increased terminal station fees and acquisition contributions meant a 4% increase in the unit’s quarterly revenues – from $151.9 million in the second quarter of 2016 to $158.6 million.
Moreover, the segment's operating income came in at $56.0 million, which marks a 10% improvement from $51.1 million earned in the year-ago quarter.
Fuels Marketing: The unit reported operating income of $289,000, dropping significantly from the year-ago profit of $1.4 million. Results were hampered by a 9% dip in revenues from product sales.
Costs & Expenses
The partnership incurred total costs of $362.1 million, up 4% year-over-year. In particular, operating expenses came in at $116.4 million - 3% higher from the corresponding period of last year.
Balance Sheet
As of Jun 30, 2017, the partnership had total debt of $3,521.9 million, which represents a debt-to-capitalization ratio of 58.5%.
Guidance
NuStar estimates growth spending for the year in the $380-$420 million range, while reliability expenses are expected to be between $35 million and $55 million. Total EBITDA for 2017 is expected to be $600 million to $650 million, with $110-$120 million in general and other expenses.
How Have Estimates Been Moving Since Then?
Following the release, investors have witnessed a downward trend in fresh estimates. There have been two revisions lower for the current quarter compared to one higher. In the past month, the consensus estimate has shifted lower by 21% due to these changes.
VGM Scores
At this time, Nustar Energy's stock has a subpar Growth Score of D, though it is doing a bit better on the momentum front with an C. Charting a somewhat similar path, the stock was allocated a grade of D on the value side, putting it in the bottom 40% for this investment strategy.
Overall, the stock has an aggregate VGM score of F. If you aren't focused on one strategy, this score is the one you should be interested in.
Our style scores indicate that the stock is suitable solely for momentum investors.
Outlook
Estimates have been broadly trending downward for the stock. The magnitude of this revision also indicates a downward shift. The stock has a Zacks Rank #5 (Strong Sell). We are expecting a below average return from the stock in the next few months.
Nustar Energy L.P. (NS): Free Stock Analysis Report
Original post
Zacks Investment Research

