Risk-off conditions gripped markets across all asset classes during the final week of February. The stock market and prices across all asset classes moved lower as many investors and traders exited positions and moved to the sidelines. The outbreak of coronavirus and fears of a global pandemic caused periods of panic selling. On the final day of February, the Chairman of the U.S. Federal Reserve told markets that the central bank was ready to do whatever was necessary to calm the volatile markets in the face of the virus.
On Tuesday, March 3, the Fed put words into action with an emergency 50 basis point rate cut. While the kneejerk reaction in the stock market was an uptick, stocks finished the day significantly lower, with all of the leading indices between 2.80% and 3.00% lower. On the final day of February, the energy commodity fell to a new low of $1.642 per MMBtu, just 3.1 cents above the March 2016 low and 3.2 cents higher than the bottom from 1998. In a risk-off environment, both longs and shorts move to the sidelines. In natural gas, the trend has been lower since early November, with both supply and demand fundamental and technical data and indicators pointing lower. However, the overabundance of speculative shorts caused some risk-off behavior in the energy commodity that pushed the price higher. Natural gas jumped above the $1.90 level before selling returned to the market. The United States Natural Gas Fund (NYSE:UNG) tracks the price of the NYMEX futures higher and lower. The UGAZ and DGAZ triple leveraged products magnify the price moves but suffer from the time decay that creates the instrument’s gearing.
Bearish Fundamentals Pushed Price To New Lows On February 28
Supply and demand fundamentals in the natural gas market have weighed on the price of the energy commodity throughout the 2019/2020 peak season during the winter months. According to the Energy Information Administration, stockpiles of natural gas in storage across the United States were at over 48% above last year’s level and above 9% over the five-year average at the end of February. The high level of stocks during the withdrawal season combined with seasonally warm temperatures and caused the price of natural gas to make lower highs and lower lows since early November. On the final day of February, the price of April natural gas futures fell to a new low for the year at $1.642 per MMBtu. On Sunday evening, March 8, the price slipped to a new low for this century when it traded to 1.6100 per MMBtu, the lowest price since 1998.
Every Attempt At A Rally Failed Since November
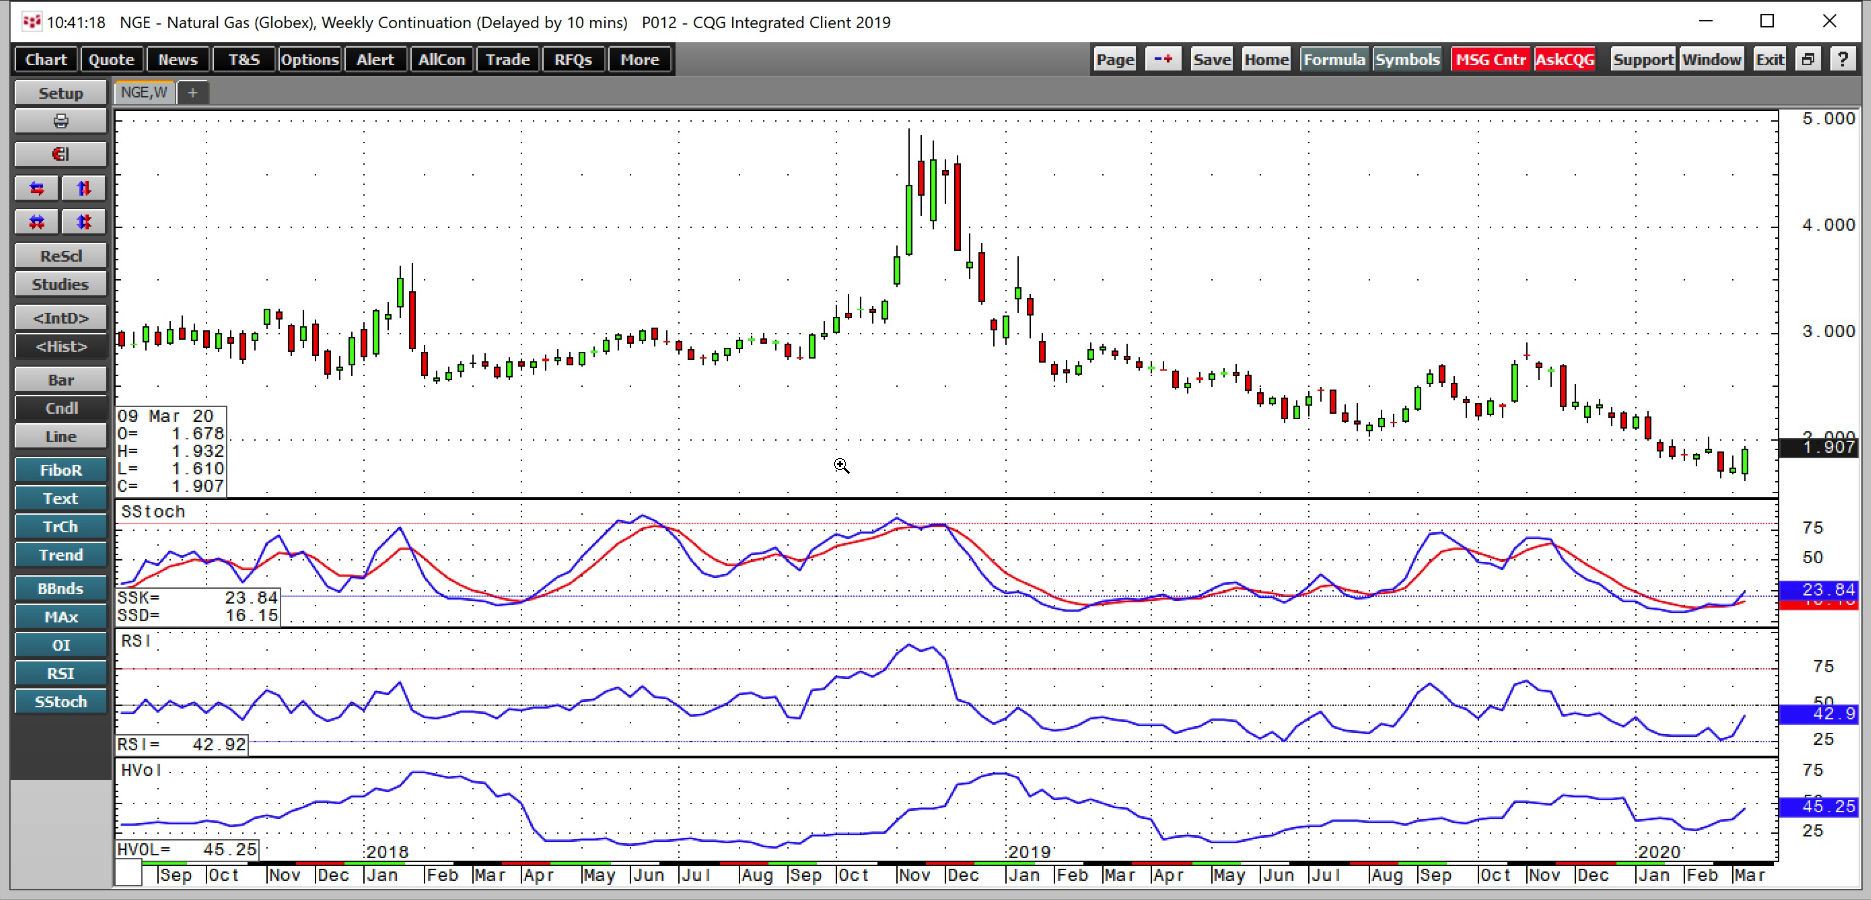
Bearish supply and demand fundamentals created the condition for the downtrend that has caused the price to fail on any attempt at a recovery since early November 2019.

(Source: CQG)
As the weekly chart highlights, natural gas rose to a high of $4.929 per MMBtu at the start of the 2018/2019 peak season for demand, but in November 2019, it only made it to a high of $2.905 per MMBtu. Since then, selling overwhelmed the market during every attempt to move higher. After reaching a low of $1.753 in mid-February, the price briefly probed above the $2 level the following week. After the recent low of $1.642 on February 28, the price ran out of buying during a recovery that took it to $1.847 per MMBtu on March 5. Natural gas traded to a lower low at $1.61 on March 9 and put in a bullish reversal on that day when other markets were plunging. Price momentum and relative strength indicators on the weekly chart were in oversold territory at the start of this week. At the same time, weekly historical volatility climbed from under 28% in mid-February to 45.50% as weekly trading ranges have expanded.
The Reason Risk-Off Pushed Natural Gas Higher
While fundamentals pointed to a new low for this century, one metric was a sign that risk-off could stop the descent of the price of natural gas futures. Risk-off behavior has been rising in markets across all asset classes over the past weeks. At the start of this week, the failure of OPEC to agree on a production cut pushed the price of crude oil to its lowest price since 2016 at just over $27.34 per barrel on the nearby NYMEX crude contract.
As a result of this precipitous drop in oil, the market is now expecting a sharp reduction in U.S. shale oil drilling, which is seen as a positive for natural gas prices. We have seen a glut of natural gas supply in the U.S. over the past few months, and with this reduction in drilling (for all fossil fuels), it is now assumed that production will decline later in 2020. Less supply will drive natural gas prices higher.
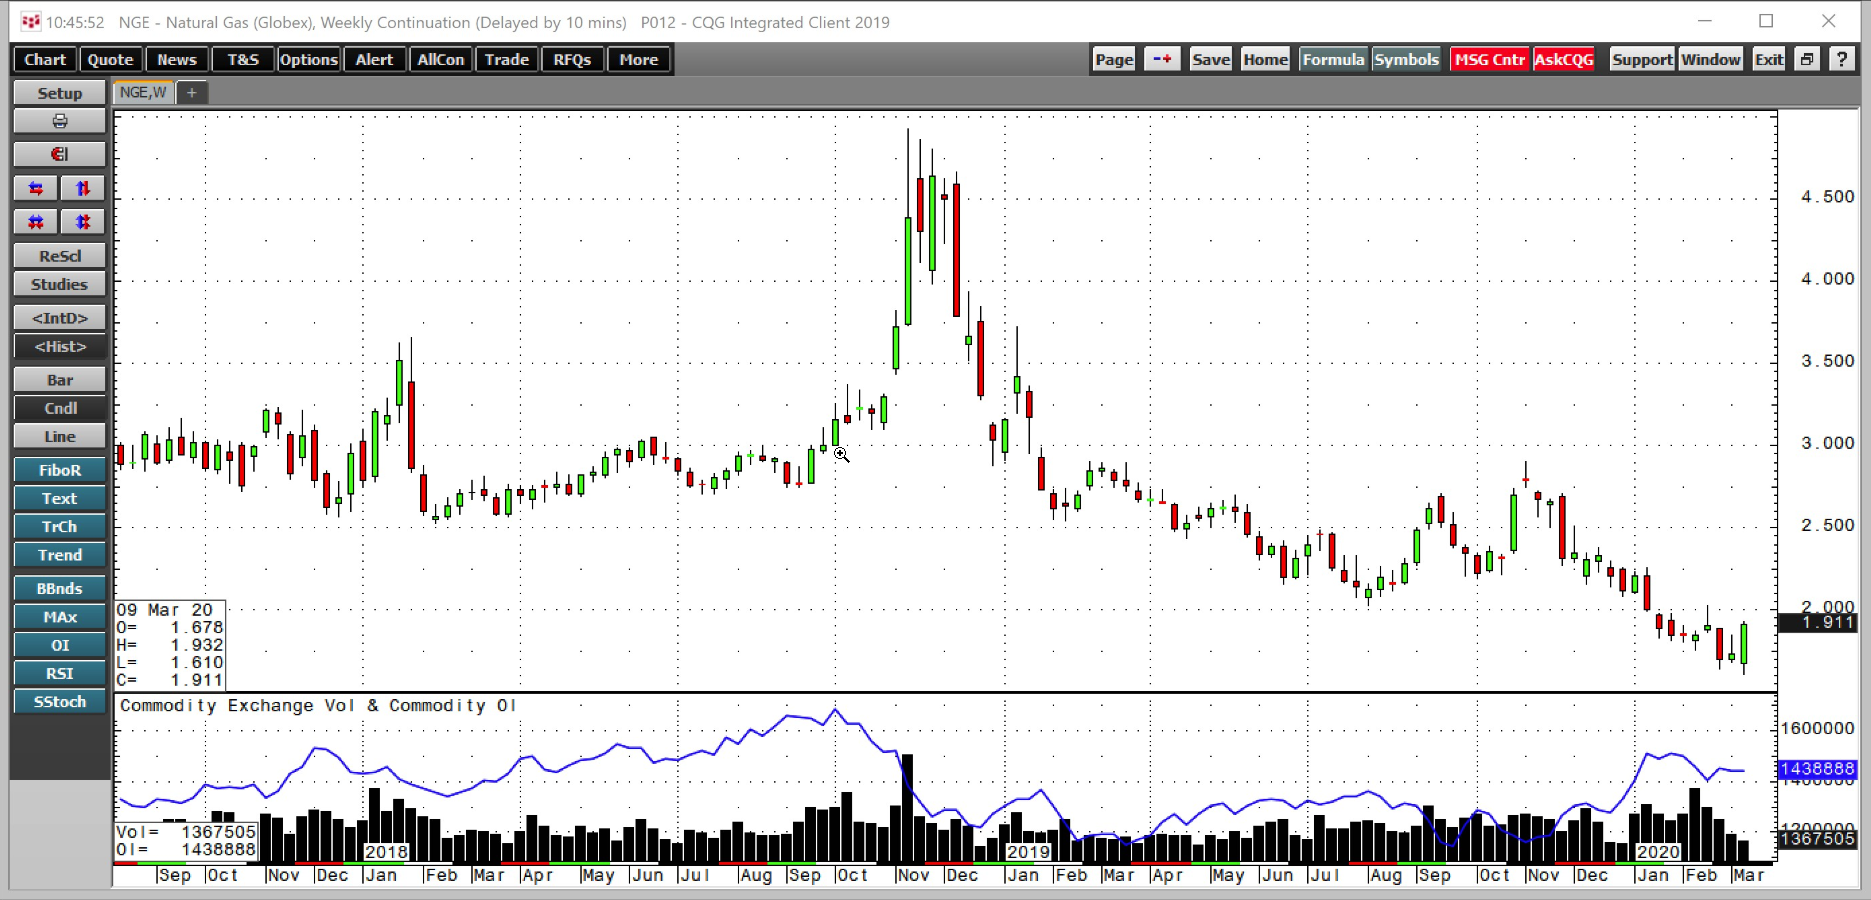
Open interest is the total number of open long and short positions in a futures market. The trend and fundamentals in the natural gas market favor the downside, so the number of trend-following and speculative shorts remained at an elevated level at the end of last week.
( Source: CQG)
The weekly chart shows that the open interest metric was at 1.439 million contracts as of March 6, 2020. Around the same time, in March 2019, the metric was at 1.192 million contracts, 247,000 contracts, or 17.2% lower. Risk-off conditions likely caused speculators to move to the sidelines in natural gas, creating short-covering and pushing the price higher.

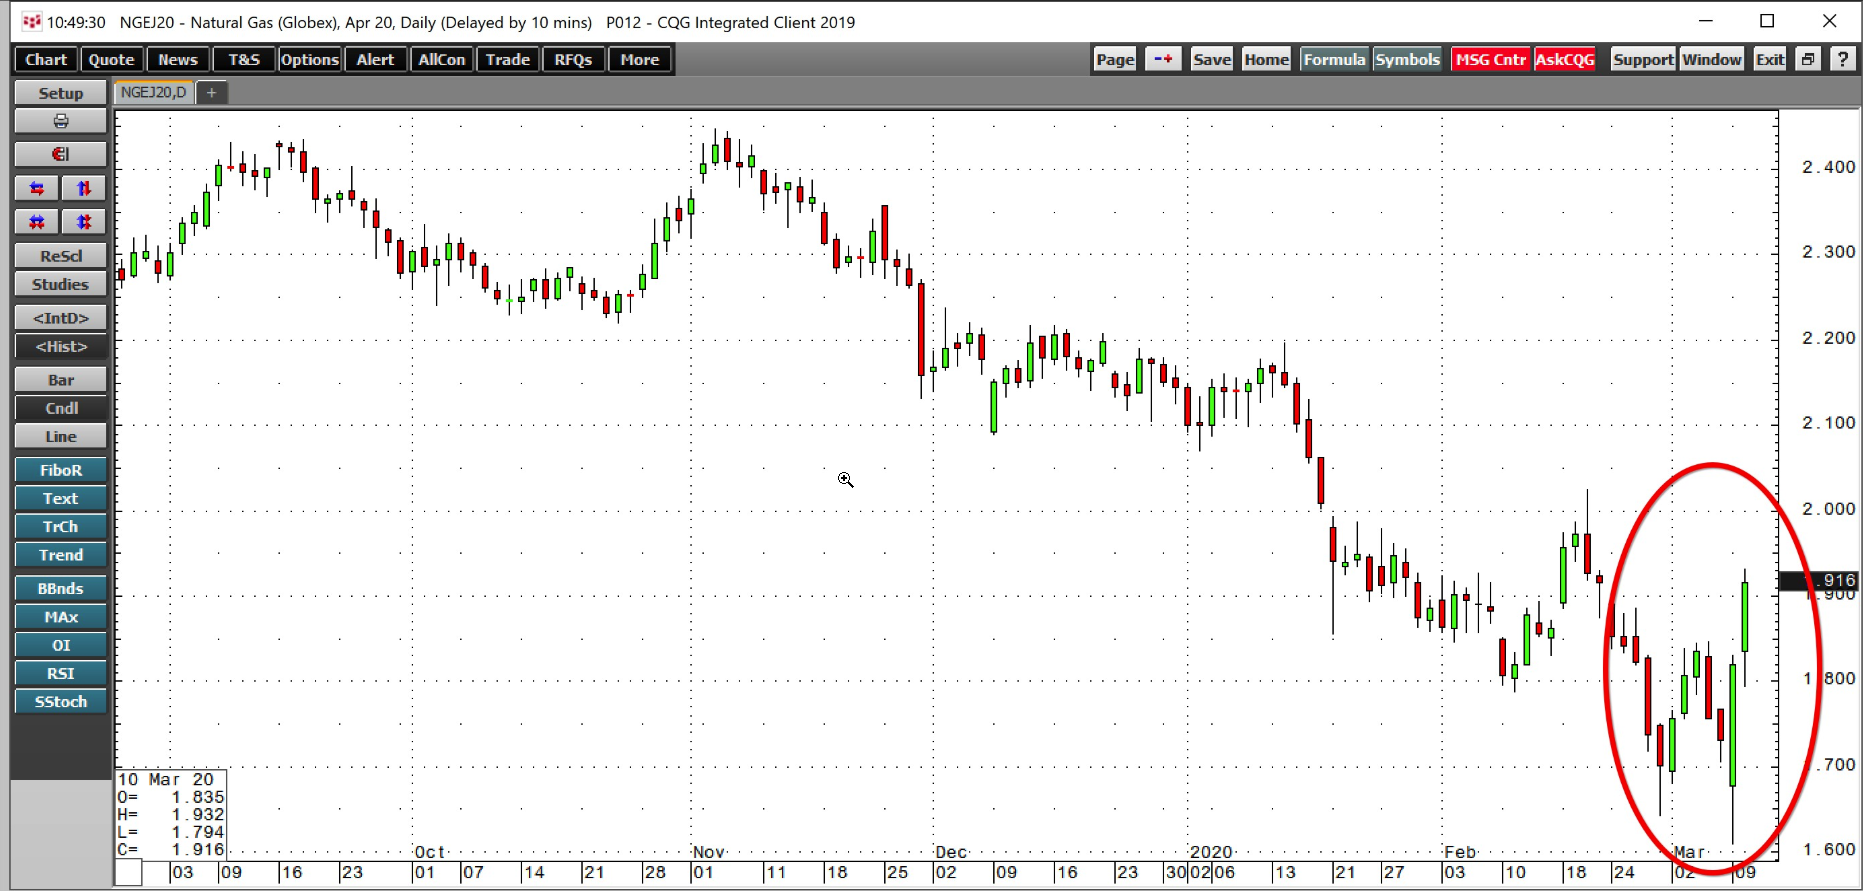
The daily chart shows that after falling below the March 2016 low by one tick or $0.001 per MMBtu, natural gas turned higher as short covering created a bullish reversal trading pattern on the daily chart. April futures were over the $1.90 level on March 10 after trading over 30 cents lower at the start of the week.
Risk-off may have been the most bullish input for the natural gas market as it caused speculators to cover positions and move to the sidelines. While energy-related equities have been suffering throughout 2019 and in 2020, natural gas producers with the cheapest proven reserves, the greatest production, could turn out to be the biggest energy equity winners if we have seen the bottom for the price of natural gas at $1.61 on March 9.
The United States Natural Gas Fund L.P. (UNG) was trading at $14.73 per share on Tuesday afternoon, up $0.63 (+4.47%). Year-to-date, UNG has declined -36.84%, versus a 3.88% rise in the benchmark S&P 500 index during the same period.
UNG currently has an ETF Daily News SMART Grade of C (Neutral), and is ranked #51 of 109 ETFs in the Commodity ETFs category.
