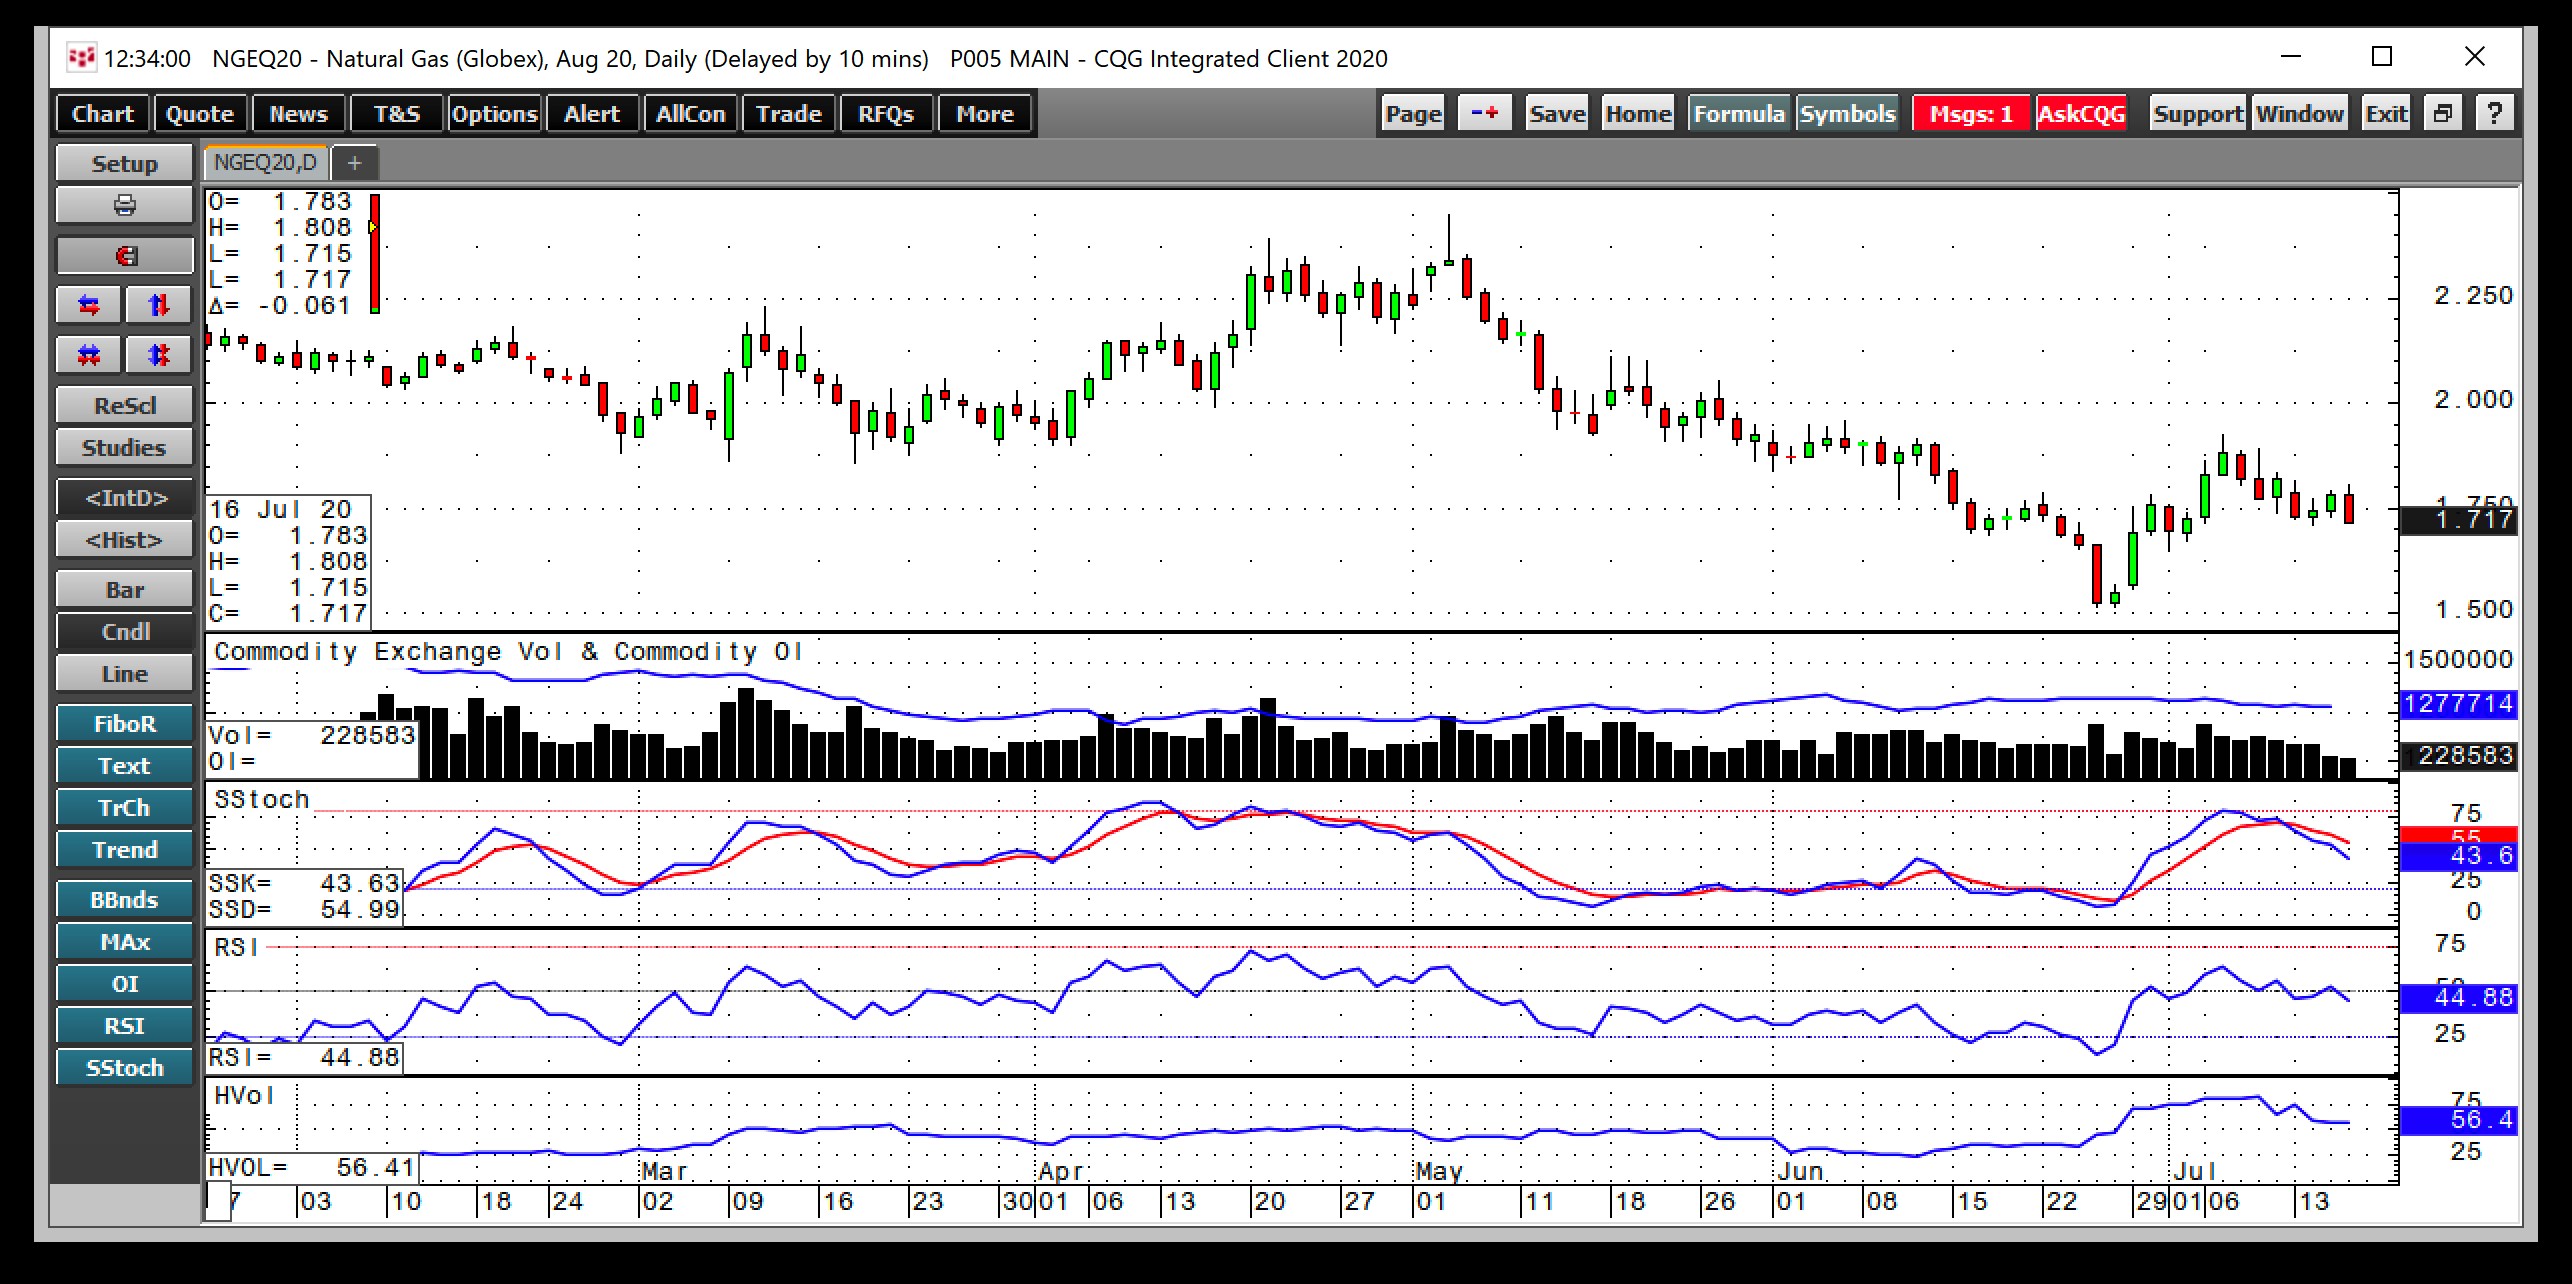
Since June 25, August natural gas futures contract’s trading range has been from $1.517 to $1.924. At the $1.75 per MMBtu level on Thursday, July 16, the price was just above the band’s midpoint. The August contract rallied from March through early May, reaching a peak of $2.447 on May 5. Natural gas plunged by 93 cents or 38% by the end of June, before the most recent recovery.
Last week, Baker Hughes reported that 75 natural gas rigs were operating in the United States, down one from the previous week. At this time last year, 172 rigs were extracting natural gas from the crust of the earth. The falling rig count weighs on production. According to the Energy Information Administration, the demand for the energy commodity has been weak, and inventories remain far higher than last year and the five-year average.
Natural gas was battling bullish and bearish factors at the $1.75 per MMBtu level when the EIA released its latest inventory data on July 16. The United States Natural Gas Fund (NYSE:UNG) tracks the price action in the volatile natural gas futures market.
Market Expected an Injection of 44 bcf For Week Ending July 10
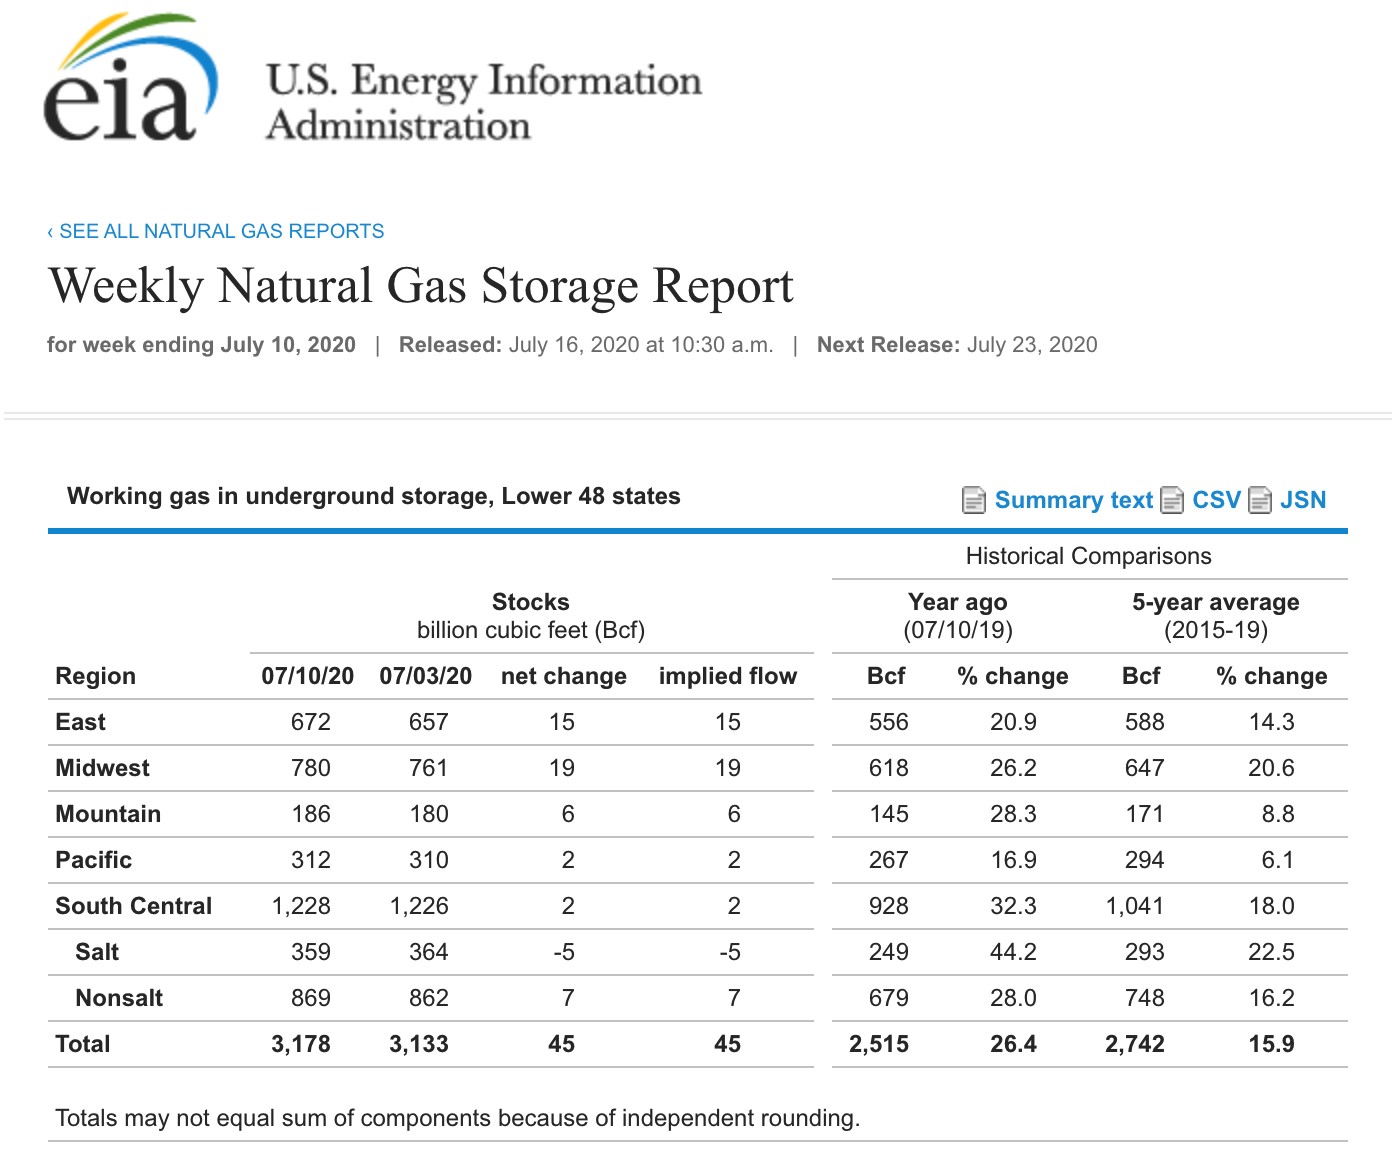
According to Estimize, a crowdsourcing website, the market consensus for the week ending on July 10 was for a 44 billion cubic feet injection of natural gas into storage across the U.S. for the week ending on July 10.

Source: EIA
As the chart shows, the injection almost matched the consensus estimate as the EIA reported a 45 bcf injection. Total inventories stood at 3.178 trillion cubic feet, which was 26.4% above last year’s level and 15.9% above the five-year average.

Source: CQG
As the 10-minute chart shows, the price of the energy commodity moved lower to under $1.75 per MMBtu in the aftermath of the weekly data.
Third Consecutive Week Of Falling Injections
The July 10 data marked the third straight week of declining injections into storage. After rising by 120 bcf for the week ending on June 19, the trend has been lower with a 65, 56 and 45 builds in inventories over the past three weeks. Moreover, July 10 marked the sixteenth straight week where the percentage above last year’s stockpile level declined.
According to Baker Hughes, the number of natural gas rigs operating in the U.S. is less than half last year’s level. Falling production, declining injections into inventory, and increased demand for cooling during the hottest summer months are not bearish for the price of the energy commodity.
Natural Gas Sits At Middle Of Its Recent Trading Range
Since trading to a low of $1.517 on June 25 and 26, natural gas recovered to a high of $1.924 per MMBtu on July 7. The midpoint of the range is $1.7205.

Source: CQG
As the chart illustrates, the energy commodity for August delivery was sitting in the middle of the trading band after the latest inventory data from the EIA on July 16. Price momentum and relative strength indicators were just below neutral readings, and daily price volatility declined from over 82% on July 9 to 55.5% on July 16. Open interest at 1.278 million contracts has been trending slightly lower since the price hit its most recent high on July 7. Falling open interest and the declining price is not typically a validation of a bearish trend in a futures market.
Support is at the double bottom formation from late July with technical resistance at the most recent high. A close below $1.728 per MMBtu on July 16 would create a bearish reversal on the daily natural gas chart. I continue to believe that the inventory data and falling production is a supportive factor for natural gas. However, I would only attempt a long position with a tight stop as the price action remains bearish after the most recent EIA data.
