
It has been about a month since the last earnings report for Dollar Tree, Inc. (NASDAQ:DLTR) . Shares have lost about 15.5% in that time frame, underperforming the market.
Will the recent negative trend continue leading up to the stock's next earnings release, or is it due for a breakout? Before we dive into how investors and analysts have reacted as of late, let's take a quick look at its most recent earnings report in order to get a better handle on the important catalysts.
Dollar Tree Lowers Outlook as Q1 Earnings Miss Estimates
Dollar Tree posted first-quarter fiscal 2017 results, wherein quarterly adjusted earnings of $0.98 per share jumped 10.1% year over year, though it fell a penny short of the Zacks Consensus Estimate. Nonetheless, earnings met the higher end of company’s guidance range of $0.91–$0.98 per share.
Including one-time items like the receivable impairment charge associated with Dollar Express, the company’s earnings slumped 13.3% to $0.85 per share. Notably, Dollar Tree had divested stores to Dollar Express, as part of its efforts to gain FTC’s approval on its merger with Family Dollar. However, Dollar Express is currently on liquidation track, thus failing to repay Dollar Tree its receivables from the former. Consequently, Dollar Tree evaluated its divestiture-related receivables in the first quarter, which will be written down eventually, with its impairment charges being recorded in the income statement.
Consolidated net sales jumped 4% to $5,287.1 million in the quarter, almost meeting the Zacks Consensus Estimate of $5,293 million.
Comparable store sales (comps) for the quarter inched up 0.5%, backed by improved customer count and average ticket. While Dollar Tree banner posted comps growth of 2.5%, comps at the Family Dollar banner declined 1.2%.
The company’s quarterly gross profit advanced 4.7% year over year to $1,627 million, with the gross margin expanding 20 basis points (bps) to 30.8%. The margin enhancement was driven by reduced merchandise and freight expenses, somewhat negated by greater markdowns.
Selling, general and administrative expenses escalated 110 bps to 23.4% of sales, primarily due to impairment related charges, higher payroll and advertising costs, partly compensated by reduced depreciation.
Balance Sheet
Dollar Tree ended the quarter with cash and cash equivalents of $1,154.9 million, net merchandise inventories of $2,878.4 million, net long-term debt of $6,131.7 million and shareholders’ equity of $5,609 million.
Store Update
Dollar Tree opened 164 outlets, expanded or relocated 51 outlets, and shuttered 16 outlets during the quarter.
Looking Ahead
Management remains pleased with its quarterly performance, which witnessed improved margins and comps, with efficient cost management. Also, adjusted earnings met the higher end of the company’s predicted range, with sales coming near the mid-point of its projected band. Further, the company is progressing quite well with Family Dollar’s integration. The company further revealed that it is well on track with its expansion efforts for both Dollar Tree and Family Dollar, and is set to initiate renovation efforts for the latter in the second quarter.
However, the company trimmed its fiscal 2017 sales guidance, alongside curtailing its earnings forecast.
Management now forecasts net sales for fiscal 2017 (which will contain an additional week) in the band of $21.95–$22.25 billion, compared with the old projection of $21.94–$22.33 billion. The guidance stems from square footage growth, and comps improvement in the range of slightly positive to low single-digit rise as compared with flat to low single-digit increase expected earlier.
Earnings per share for fiscal 2017 are now expected to be in the range of $4.17–$4.43, which includes an impairment charge of $0.13 recorded in the first quarter. Earlier, management projected earnings in a band of $4.20–$4.56 per share in fiscal 2017. The impact on sales and earnings from the 53rd week is included in management’s outlook.
For the fiscal second quarter, consolidated sales are projected in the range of $5.18–$5.28 billion, driven by comps growth in a slightly positive to low single-digit rise range for the combined entity. Earnings are anticipated in the range of $0.80–$0.88 per share.
How Have Estimates Been Moving Since Then?
Analysts were quiet during the last one month period as none of them issued any earnings estimate revisions.
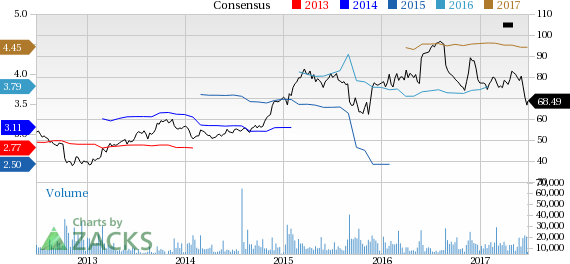
Dollar Tree, Inc. Price and Consensus
VGM Scores
At this time, the stock has a strong Growth Score of 'A', though it is lagging a bit on the momentum front with a 'B'. Charting a somewhat similar path, the stock was allocated a grade of 'A' on the value side, putting it in the top 20% for this investment strategy.
Overall, the stock has an aggregate VGM Score of 'A'. If you aren't focused on one strategy, this score is the one you should be interested in.
Based on our scores, the stock is more suitable for value and growth investors than momentum investors.
Outlook
The stock has a Zacks Rank #3 (Hold). We are expecting an inline return from the stock in the next few months.
Dollar Tree, Inc. (DLTR): Free Stock Analysis Report
Original post
Zacks Investment Research