
It has been about a month since the last earnings report for Core Laboratories N.V. (NYSE:CLB) . Shares have added about 15.1% in that time frame, outperforming the market.
Will the recent positive trend continue leading up to the stock's next earnings release, or is it due for a pullback? Before we dive into how investors and analysts have reacted of late, let's take a quick look at the most recent earnings report in order to get a better handle on the important drivers.
Third-Quarter 2017 Results
Oilfield services company Core Laboratories reported third-quarter 2017 adjusted earnings of 48 cents per share, surpassing the Zacks Consensus Estimate of 44 cents. The figure also compared favorably with the prior-year quarter adjusted earnings of 38 cents.
Total revenue of $166 million surpassed the Zacks Consensus Estimate of $161 million. Revenues were up from the prior-year quarter level of $143 million. The better-than-expected results were driven by improved performance of the Product Enhancement segment.
Although the company’s operations in the third quarter were affected by Harvey, Irma and Maria, it surpassed its updated guidance. Damages to the company’s facilities were minor. Despite the unfavorable situations faced by the company and its clients due to flooding, power outages and wind damages caused by the hurricanes, its results were better than the year-ago quarter, thanks to the rising demand for the company’s products.
Segment Performance
Reservoir Description: Segment revenues were $101.4 million compared with $105.4 million in third-quarter 2016. Client workflow disruptions by the hurricanes affected the results.
Operating income for the segment was about $14.6 million in the reported quarter compared with $21.3 million in the prior-year quarter. Operating margin for the reported quarter was 14%.
Production Enhancement: Segment revenues were approximately $64.8 million in the reported quarter compared with $38.1 million in third-quarter 2016. Increased demand for the company’s advanced technology solutions helped in generating better revenues.
Operating income for the segment was about $13 million in the reported quarter compared with $118,000 in the prior-year quarter, reflecting a significant rise%.
Balance Sheet and Free Cash Flow
As of Sep 30, 2017, Core Laboratories had cash and cash equivalents of $13.8 million and long-term debt (including lease obligations) of around $233.9 million. The debt-to-capitalization ratio of the company was 60.4%. Capital expenditures for the third quarter were $4.9 million.
The company generated free cash flow of approximately $25 million in third-quarter 2017.
Quarterly Dividend
On Oct 10, the board of directors announced a cash dividend of 55 cents per share. Notably, this is same as the previous payout.
Guidance
For the fourth quarter, Core Laboratories expects earnings to be around 58 cents per share. The company expects fourth-quarter revenues to be around $171.5 million. The expected sequential increase is based on a shift in the company’s focus from production oriented growth to the deployment of advanced technological solutions. Moreover, oil companies trying to maximize their recovery from the existing producing fields are also expected to create additional demand for its technological solutions.
How Have Estimates Been Moving Since Then?
It turns out, fresh estimates flatlined during the past month. There has been one revision higher for the current quarter compared to one lower.
Core Laboratories N.V. Price and Consensus
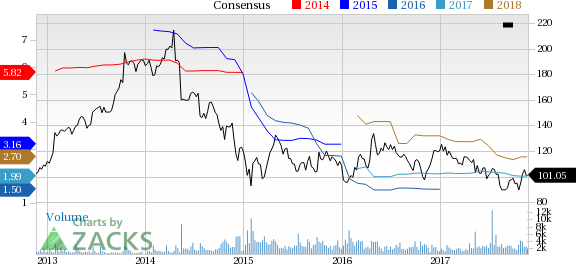
Core Laboratories N.V. Price and Consensus | Core Laboratories N.V. Quote
VGM Scores
At this time, Core Laboratories' stock has a nice Growth Score of B, though it is lagging a bit on the momentum front with a C. However, the stock was allocated a grade of F on the value side, putting it in the fifth quintile for this investment strategy.
Overall, the stock has an aggregate VGM Score of C. If you aren't focused on one strategy, this score is the one you should be interested in.
Our style scores indicate that the stock is more suitable for growth investors than momentum investors.
Outlook
Notably, the stock has a Zacks Rank #3 (Hold). We expect in-line returns from the stock in the next few months.
Core Laboratories N.V. (CLB): Free Stock Analysis Report
Original post
Zacks Investment Research