
It has been about a month since the last earnings report for Cliffs Natural Resources Inc. (NYSE:CLF) . Shares have lost about 8.7% in that time frame, underperforming the market.
Will the recent negative trend continue leading up to the stock's next earnings release, or is it due for a breakout? Before we dive into how investors and analysts have reacted as of late, let's take a quick look at its most recent earnings report in order to get a better handle on the important catalysts.
Cliffs Natural Records Loss in Q1, Revenues Top
Cliffs Natural reported net loss (attributable to Cliffs shareholders) of $28.1 million or $0.11 per share in the first quarter of 2017, versus net earnings (attributable to Cliffs shareholders) of $108 million or $0.62 logged in the year-ago quarter. Analysts polled by Zacks were expecting earnings of $0.16 on average for the quarter.
Sales for the quarter came in at $461.6 million, surging 51% from $305.5 million in the prior-year quarter. Sales beat the Zacks Consensus Estimate of $373 million.
Segment Performance
U.S. Iron Ore: U.S. Iron Ore pellet sales volume was 3,118 million long tons in the first quarter, compared with 1,910 million tons in the year-ago quarter. The rise was mainly due to increased customer demand.
Revenues per ton declined 5% year over year to $79.35. Cash production cost per ton fell 7% year over year to $58.57 in the reported quarter. The decrease was mainly due to having absence of active mines during the quarter.
Asia Pacific Iron Ore: Sales volumes in the segment increased 9% year over year to 3 million metric tons. The increase was attributed to the timing of the shipment.
Revenues per ton were $54.35, up around 32% compared to prior-year quarter. Cash production cost per ton was $37.27, up around 15% from the year-ago quarter. The increase was due to higher royalties, increased mining costs, and unfavorable exchange rates.
Financial Position
Cliffs had $295.3 million of cash and cash equivalents as of Mar 31, 2017, compared with $59.9 million as of Mar 31, 2016.
Long-term debt was at $1,642.9 million as of Mar 31, 2017, compared with $2,175.1 million as of Mar 31, 2016.
Capital expenditure was $28 million for the first quarter, compared to $10 million the first quarter of 2016. Depreciation, depletion and amortization were $23.2 million in the quarter.
Outlook
For 2017, Cliffs now expects to generate net income of roughly $380 million. The revised outlook is based on assumptions based on realization of Asia Pacific Iron Ore revenues, which are likely to be impacted by lower IODEX prices, heavy iron ore content discounts and lower lump premiums.
The company projects its full-year selling, general and administrative (SG&A) expenses to be around $100 million of which $25 million is expected to be non-cash expenses.
The company's interest expense for 2017 is anticipated to be roughly $175 million, of which $20 million is expected to be non-cash.
Cliffs expects its 2017 capital expenditures to be $105 million.
U.S. Iron Ore Outlook
For 2017, Cliffs expects sales and production volume of 19 million long tons for the segment. Further, the company expects iron-ore cash cost of goods sold and operating expense to be in the range of $55−$60 per long ton.
Asia Pacific Iron Ore Outlook
For 2017, Cliffs projects sales and production volume of roughly 11.5 million tons for the Asia Pacific Iron Ore operation. Moreover, the company expects iron-ore cash cost of goods sold and operating expense to be in the range of $34−$39 per metric ton.
How Have Estimates Been Moving Since Then?
Following the release, investors have witnessed a downward trend in fresh estimates. There have been two revisions lower for the current quarter. In the past month, the consensus estimate has shifted downward by 19.2% due to these changes.
Cliffs Natural Resources Inc. Price and Consensus
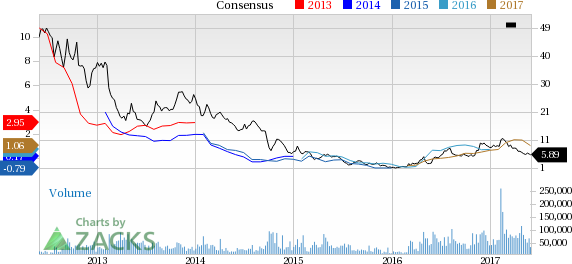
Cliffs Natural Resources Inc. Price and Consensus | Cliffs Natural Resources Inc. Quote
VGM Scores
At this time, Cliffs Natural's stock has a subpar Growth Score of 'D', while it is lagging a bit on the momentum front with 'F'. However, the stock was allocated a grade of 'A' on the value side, putting it in the top quintile for this investment strategy.
Overall, the stock has an aggregate VGM Score of 'C'. If you aren't focused on one strategy, this score is the one you should be interested in.
The company's stock is suitable solely for value based on our styles scores.
Outlook
Estimates have been broadly trending downward for the stock. The magnitude of this revision also indicates a downward shift. Notably, the stock has a Zacks Rank #3 (Hold). We are expecting an inline return from the stock in the next few months.
Cliffs Natural Resources Inc. (CLF): Free Stock Analysis Report
Original post
Zacks Investment Research