
It has been about a month since the last earnings report for Capital One Financial Corporation (NYSE:COF) . Shares have lost about 7.5% in the past month, underperforming the market.
Will the recent negative trend continue leading up to its next earnings release, or is COF due for a breakout? Before we dive into how investors and analysts have reacted as of late, let's take a quick look at the most recent earnings report in order to get a better handle on the important catalysts.
Capital One Q4 Earnings Improve Y/Y, Costs Up
Capital One fourth-quarter 2017 adjusted earnings of $1.62 per share increased 2.5% year over year. The Zacks Consensus Estimate was $1.83.
Results benefited from a rise in revenues and easing margin pressure. Also, the quarter witnessed a rise in loan and deposit balances. However, increase in provisions and expenses were the undermining factors.
After taking into consideration charges related the tax act and other non-recurring items, net loss for the quarter was $971 million or $2.17 per share. This compared unfavorably with prior-year quarter’s net income of $791 million or $1.45 per share.
For 2017, adjusted earnings per share of $7.74 were up 7% year over year. The Zacks Consensus Estimate was $7.47. After considering several notable one-time items, net income was $1.98 billion or $3.49 per share, down from $3.75 billion or $6.89 per share in 2016.
Revenue Growth Supports Results
Net revenues were $7.01 billion, up 7% from the prior-year quarter. However, the figure missed the Zacks Consensus Estimate of $7.12 billion.
For 2017, net revenues grew 7% year over year to $27.24 billion. However, it lagged the Zacks Consensus Estimate of $27.37 billion.
Net interest income increased 7% from the prior-year quarter to $5.81 billion. Also, net interest margin increased 18 basis points (bps) year over year to 7.03%.
Non-interest income increased 7% year over year to $1.2 billion. The increase was mainly driven by a rise in net interchange fees, partially offset by a decline in other income, and service charges and other customer-related fees.
Non-interest expenses of $3.78 billion increased 3% from the year-ago quarter. All cost components, except amortization of intangibles, occupancy and equipment, marketing and professional services, rose year over year.
Efficiency ratio came in at 53.89% compared with 56.03% in the year-ago quarter. A decrease in efficiency ratio indicates improved profitability.
Credit Quality Worsens
Net charge-off rate surged 41 bps year over year to 2.89%. Further, provision for credit losses rose 10% from the year-ago quarter to $1.93 billion.
Also, the 30-plus day performing delinquency rate jumped 30 bps year over year to 3.23%. Likewise, allowance, as a percentage of reported loans held for investment was 2.95%, up 30 bps year over year.
Strong Balance Sheet
As of Dec 31, 2017, loans held for investment were $254.47 billion, up 1% from the prior quarter. Total deposits, as of the same date, increased 2% sequentially to $243.7 billion.
Total stockholder’s equity was $48.73 billion as of Dec 31, 2017, a decline of 3% from the previous quarter.
Profitability Ratios Deteriorate, Capital Ratios Improve
Return on average assets was negative 0.95% at the end of the reported quarter against 0.91% in the year-ago quarter. Also, return on average common equity was negative 8.14% against 6.48% in the prior-year quarter.
As of Dec 31, 2017, Tier 1 risk-based capital ratio was 11.8%, up from 11.6% in the prior-year quarter. Further, common equity Tier 1 capital ratio under Basel III Standardized Approach was 10.3% as of Dec 31, 2017, up from 10.1% as of Dec 31, 2016.
Outlook
Management expects the impact of growth math to gradually decrease in 2018. This means that the year-over-year increase in delinquencies and charge-off rates are expected to decline gradually, as new loan balances in the front book season become a larger proportion of the overall portfolio relative to the older and highly seasoned back book.
In the long term, management remains optimistic about deriving efficiency improvement driven by growth and digital productivity gains.
In Consumer banking segment, the charge-off rate will increase gradually and loan growth will moderate.
For 2018, management expects effective tax rate to be around 19%.
How Have Estimates Been Moving Since Then?
In the past month, investors have witnessed an upward trend in fresh estimates. There have been six revisions higher for the current quarter compared to one lower. In the past month, the consensus estimate has shifted up 8% due to these changes.
Capital One Financial Corporation Price and Consensus
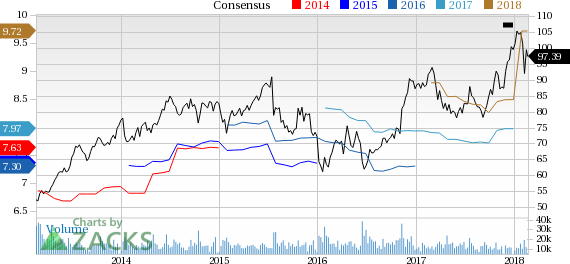
Capital One Financial Corporation Price and Consensus | Capital One Financial Corporation Quote
VGM Scores
At this time, COF has a subpar Growth Score of D, however its Momentum is doing a lot better with a B. Charting a somewhat similar path, the stock was also allocated a grade of A on the value side, putting it in the top quintile for this investment strategy.
Overall, the stock has an aggregate VGM Score of B. If you aren't focused on one strategy, this score is the one you should be interested in.
Our style scores indicate that the stock is more suitable for value investors than momentum investors.
Outlook
Estimates have been broadly trending upward for the stock, and the magnitude of these revisions looks promising. It comes with little surprise COF has a Zacks Rank #2 (Buy). We expect an above average return from the stock in the next few months.
Capital One Financial Corporation (COF): Free Stock Analysis Report
Original post
Zacks Investment Research