
A month has gone by since the last earnings report for Arrow Electronics, Inc. (NYSE:ARW) . Shares have added about 1.7% in that time frame, outperforming the market.
Will the recent positive trend continue leading up to the stock's next earnings release, or is it due for a pullback? Before we dive into how investors and analysts have reacted as of late, let's take a quick look at the most recent earnings report in order to get a better handle on the important catalysts.
Arrow Tops Q1 Earnings, Revenue Estimates, Guides Well
Arrow started 2017 on a strong note, by reporting strong results for the first quarter. The company’s quarterly revenues and earnings not only marked a year-over-year improvement, but also surpassed the respective Zacks Consensus Estimate. The figures also came above the mid-point of the company’s guidance ranges.
Arrow’s non-GAAP earnings of $1.46 per share beat the Zacks Consensus Estimate by a couple of cents and came above the mid-point of its guidance range of $1.37–$1.49 (mid-point $1.43 per share). Moreover, earnings increased from $1.43 per share reported in the year-ago quarter. On a GAAP basis, earnings came in at $1.26 compared with $1.14 reported a year ago.
Quarter Detail
Arrow’s revenues, on a reported basis, were $5.760 billion, up 5.2% from the year-ago quarter. Quarterly revenues also surpassed the Zacks Consensus Estimate of $5.572 billion as well as came above the mid-point of the company’s guidance range of $5.375–$5.775 billion (mid-point $5.575 billion).
On a reported basis, revenues from Global components increased 10.4% to $5.059 billion. On an adjusted basis (excluding the impact of changes in foreign currencies and acquisitions), the figure grew 12%. Geographically, revenues from America and the Asia Pacific climbed 9% and 17%, respectively. Sales from Europe rose approximately 5.7% on a year-over-year basis.
Revenues at Global Enterprise Computing Solutions (ECS) came in at $1.701 billion, down 5.4% on a year-over-year basis. On an adjusted basis, revenues decreased 5.7%, primarily due to the impact of acquisition and foreign currency fluctuations. Revenues from the Americas were down 4.8% year over year, whereas revenues from Europe decreased 6.6%.
Gross margin contracted 50 basis points (bps) year over year and came in at 13.2%. Also, Arrow reported non-GAAP operating margin of 3.8%, down 10 bps. However, operating income in dollar terms, increased 2.4% year over year to $220.1 million.
The company’s non-GAAP net income was $132.4 million or $1.46 per share compared with $132.2 million or $1.43 per share last year.
Arrow exited the quarter with cash and cash equivalents of $521.6 million compared with $534.3 million at the end of fourth-quarter 2016. Long-term debt (including current portion) was $2.46 billion compared with $2.79 billion at the end of the previous quarter. During the quarter, the company had negative operating cash flow of $20.9 million. The company spent $68.8 million for share repurchases during the quarter.
Guidance
Buoyed by the splendid first-quarter performance, Arrow provided a strong revenue and earnings guidance for the second quarter which is well ahead of our expectations.
For the second quarter, sales are expected between $5.975 billion and $6.375 billion (mid-point $6.175 billion). Global components sales are projected in a range of $4.05–$4.25 billion. Global enterprise computing solutions sales are estimated to be in the range of $1.925–$2.125 billion.
The company projects non-GAAP earnings per share in a range of $1.70–$1.82 (mid-point $1.76 per share).
How Have Estimates Been Moving Since Then?
Analysts were quiet during the last one month period as none of them issued any earnings estimate revisions.
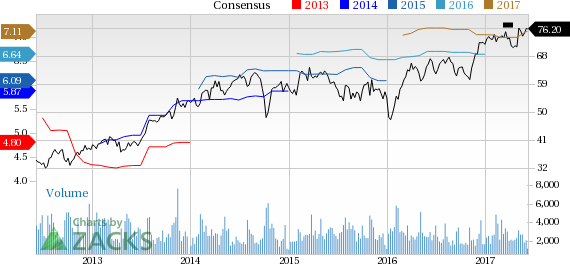
Arrow Electronics, Inc. Price and Consensus
Arrow Electronics, Inc. Price and Consensus | Arrow Electronics, Inc. Quote
VGM Scores
At this time, Arrow's stock has a subpar Growth Score of 'D', however its Momentum is doing a bit better with a 'C'. However, the stock was allocated a grade of 'A' on the value side, putting it in the top 20% for this investment strategy.
Overall, the stock has an aggregate VGM Score of 'B'. If you aren't focused on one strategy, this score is the one you should be interested in.
Our style scores indicate that the stock is more suitable for value investors than momentum investors.
Outlook
The stock has a Zacks Rank #3 (Hold). We are expecting an inline return from the stock in the next few months.
Arrow Electronics, Inc. (ARW): Free Stock Analysis Report
Original post
Zacks Investment Research