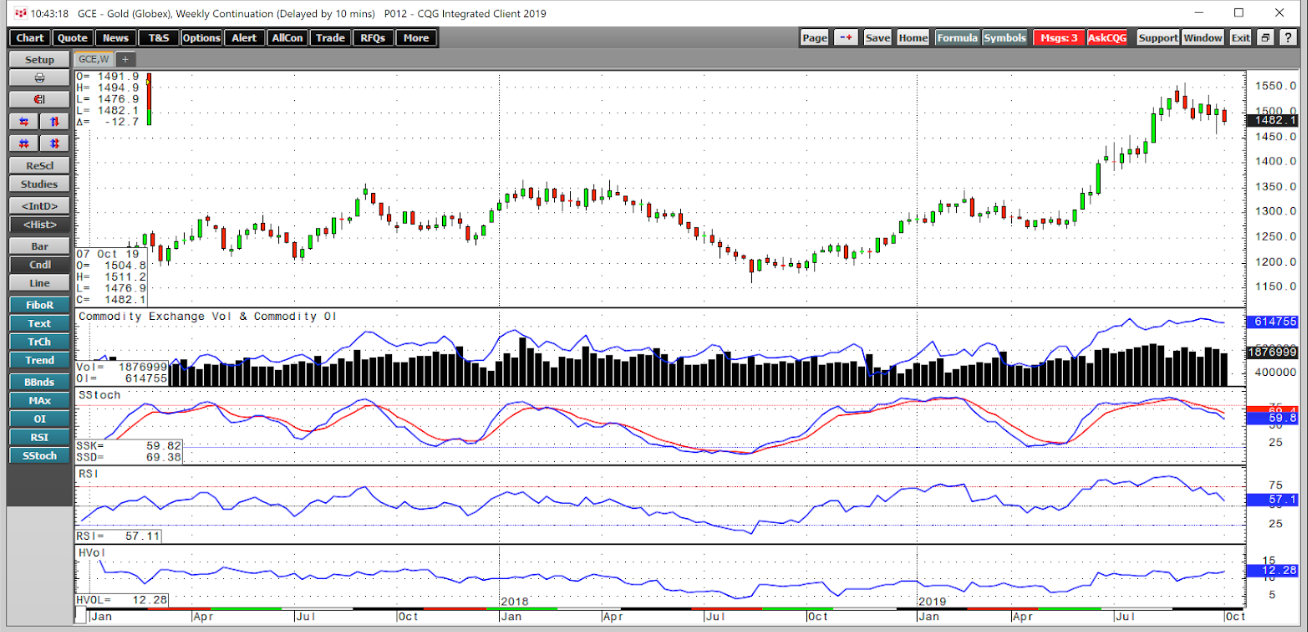
- Gold is sitting just below the $1500 per ounce level
- Open interest is elevated and flat lining
- Gold could surprise on the upside
Falling global interest rates and the ongoing trade war between the US and China created a potent bullish cocktail for the gold market. The price of the yellow metal rose above its technical resistance level at $1377.50 in June and kept on going on the upside. In early September, gold reached a peak at just under $1560 per ounce, the highest level since 2013.
The next target on the upside, above the most recent high, is at just over $1600 per ounce. Above there, the 2011 all-time peak at $1920.70 stands as the ultimate target on the upside for the gold market.
During the most recent rally, gold rose to record levels in a host of currencies. The euro is the second-leading reserve currency in the world. In early September, gold in euro terms reached its all-time high. The only leading currencies that did not see a new high in the price of gold were the US dollar and Swiss franc. Meanwhile, the precious metal appreciated in both dollars and francs since June.
Gold was trading below the $1500 per ounce level at the end of last week. As the price consolidates, the market is waiting and watching for the next event that will determine the path of least resistance for the price of the precious metal. The SPDR Gold Shares ETF product (NYSE:GLD) is highly liquid, with almost $44 billion in net assets.
Gold Is Sitting Just Below The $1500 Per-Ounce Level
The most recent high in gold came at the start of September when the continuous futures contract hit $1559.80 per ounce. Since then, the gold market has undergone a correction.Gold found at least a temporary bottom at $1458.30 on October 1. Since then, the price has been around the $1500 level, which is now a pivot point for the yellow metal. At the end of last week, gold settled at $1488.70 on the active month December futures contract.Gold began to rally in April when the price fell to its low for 2019 at $1266 per ounce. The move higher took the yellow metal 23.2% higher. While the price dropped by around $100 per ounce from the high, it remained over $80 above its level of critical technical support. The $1377.50 level was the breakout level for gold and is now the crucial level to watch on the downside.
Open Interest Is Elevated And Flat Lining
The technical picture for gold remains bullish. In 1999, gold fell to a low at $252.50 per ounce. In 2001, it made a marginally higher low at $255. Gold rose above the $400 level in 2003 and took off on the upside. In 2011, it reached an all-time peak at over $1900 per ounce and has not traded below the $1000 level in a decade.

(Source: CQG)
The weekly chart highlights that gold has been digesting the next leg to the upside in a bull market that began sixteen years ago. Open interest, the total number of open long and short positions in the futures market has been rising with the price of the yellow metal. Increasing open interest and price appreciation tends to be a validation of a bullish trend in a futures market. The measure of open interest was around 615,000 contracts at the end of last week, which is a sign of continued buying in the gold futures market.
Price momentum and relative strength indicators had risen into overbought conditions in early September. Both metrics have been gently falling as the market digests the recent move. The correction and price consolidation around the $1500 level could turn out to be a bullish factor for the price of gold.
Gold Could Surprise On The Upside
Falling global interest rates, a rising trend in gold in all currencies, the ups and downs of the trade war, Iran, Brexit, impeachment, and a host of other issues could trigger buying in the gold market in the blink of an eye.
Over the past months, the price of gold in almost all currencies except for the U.S. dollar and Swiss franc has risen to all-time highs. I continue to believe that the yellow metal will challenge and rise above its 2011 peak at $1920.70 in dollar terms.
The many issues facing the world could send market participants into the safe-haven arms of the gold market. I would not be surprised to wake up one morning and see gold at a new high above the $1600 per ounce level.
The long-term bull market in gold has corrected. The correction could be another opportunity to hop on board of the bullish train before it leaves the station for higher levels over the coming weeks and months.
The SPDR Gold Shares (NYSE:GLD) was trading at $140.68 per share on Monday afternoon, up $0.65 (+0.46%). Year-to-date, GLD has gained 13.77%, versus a 11.44% rise in the benchmark S&P 500 index during the same period.
GLD (NYSE:GLD) currently has an ETF Daily News SMART Grade of B (Buy), and is ranked #1 of 33 ETFs in the Precious Metals ETFs category.
