Regular readers know that I have been tactically bullish by calling for a Santa Claus rally. Indeed, with relative breakouts seen in emerging market and European equities (see Intriguing head and shoulders patterns), the weight of the evidence suggests a friendly risk-on environment.
Indeed, the relative performance of the Morgan Stanley Cyclical Index against the market is also suggestive of a bullish view on the economy and risky assets.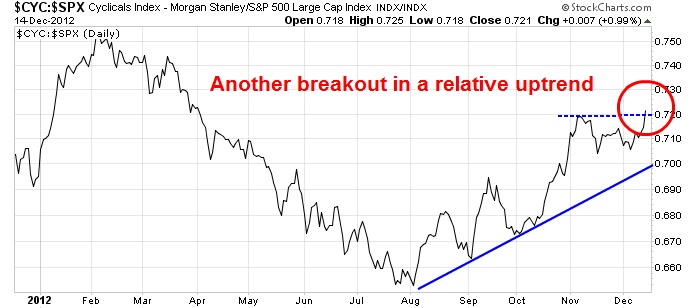
Waiting for the resource sector
Here's what's bugging me. With most of my indicators in bullish territory, why is the resource sector lagging? In particular, why aren't Materials and Energy leading this market upward? Until I can see participation from the resource sector in this rally, I remain constructive but cautious on this bull move.
Here is the relative performance of the cyclically sensitive Materials ETF (XLB) against the market (SPY). Materials remain range bound on a relative basis. While these stocks have shown some degree of relative strength in the last couple of weeks, they are by no means in a relative uptrend indicating sustainable leadership.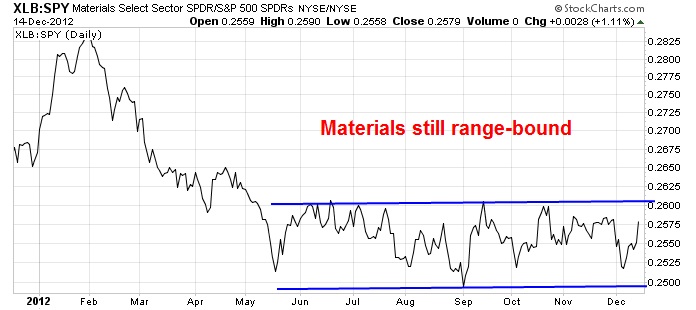
This pattern is not restricted to American stocks. The Basic Materials sector in Europe is showing a similar pattern of relative performance.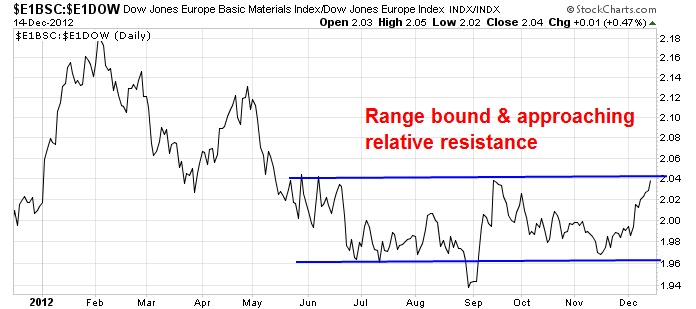
More worrisome for the bull case is the performance of the Energy sector, which is in a minor relative downtrend against the market.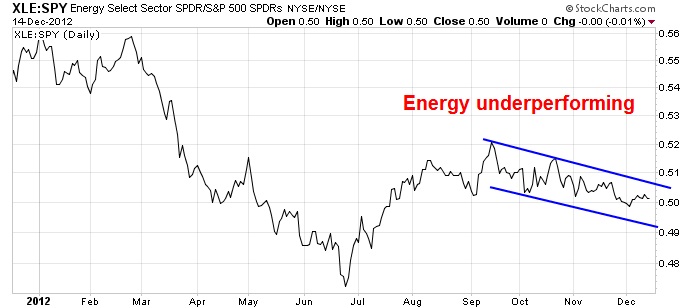
The relative performance of energy stocks in Europe can only be described as dismal: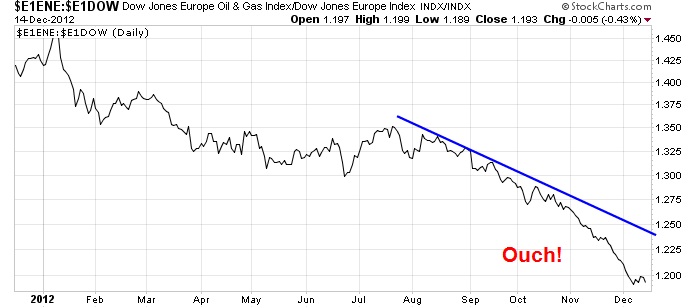
Commodity outlook
Nevertheless, I remain cautiously bullish on the outlook for commodity prices. The chart pattern for Dr. Copper, which is an important cyclically sensitive industrial commodity, appears to be constructive. The price of the red metal remains in an uptrend but, at the current rate of ascent, it will encounter important overhead resistance.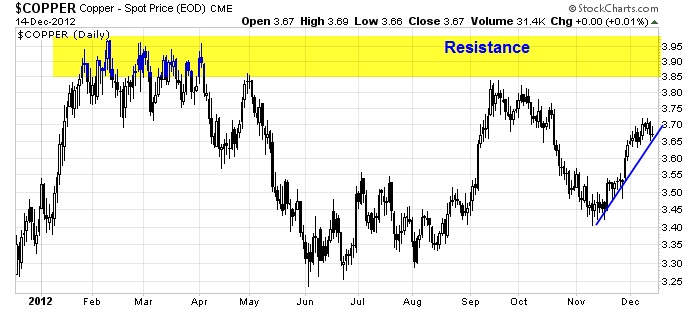
The truth of the matter is, the energy complex is underperforming (for reasons unknown). Nevertheless, a relative performance chart of the equal weight Continuous Commodity Index (CCI) against the CRB Index shows a relative uptrend indicating positive breadth.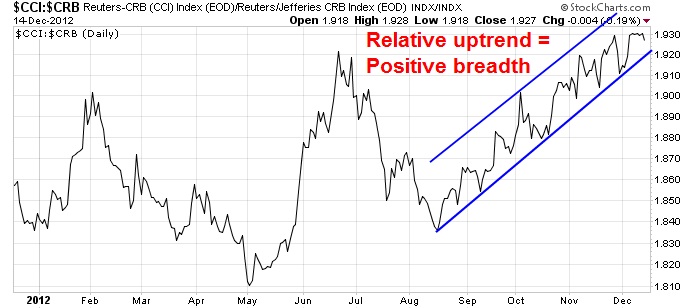
To explain, both the CCI and CRB have the same commodity components. While the CCI is equal weighted, the CRB is liquidity weighted, which gives a higher weight to the energy complex. Thus the CCI to CRB ratio is a measure of market breadth in the commodity complex. The relative uptrend shown in the above chart is an indication that the general commodity complex is performing better than the headline CRB - which is one reason why I remain cautiously bullish on the commodity outlook.
Bottom line: I am watching for commodities and commodity-related stocks to start outperforming as a sign that this rally has legs. If we don't see sustainable relative strength breakouts from the Materials and Basic Industry sectors, then I would interpret such a development as a negative divergence and a caution flag for the bulls. For now, I am inclined to give the bull case the benefit of the doubt, but I remain cautious.
Disclosure: Cam Hui is a portfolio manager at Qwest Investment Fund Management Ltd. ("Qwest"). This article is prepared by Mr. Hui as an outside business activity. As such, Qwest does not review or approve materials presented herein. The opinions and any recommendations expressed in this blog are those of the author and do not reflect the opinions or recommendations of Qwest.
None of the information or opinions expressed in this blog constitutes a solicitation for the purchase or sale of any security or other instrument. Nothing in this article constitutes investment advice and any recommendations that may be contained herein have not been based upon a consideration of the investment objectives, financial situation or particular needs of any specific recipient. Any purchase or sale activity in any securities or other instrument should be based upon your own analysis and conclusions. Past performance is not indicative of future results. Either Qwest or Mr. Hui may hold or control long or short positions in the securities or instruments mentioned.
- English (UK)
- English (India)
- English (Canada)
- English (Australia)
- English (South Africa)
- English (Philippines)
- English (Nigeria)
- Deutsch
- Español (España)
- Español (México)
- Français
- Italiano
- Nederlands
- Português (Portugal)
- Polski
- Português (Brasil)
- Русский
- Türkçe
- العربية
- Ελληνικά
- Svenska
- Suomi
- עברית
- 日本語
- 한국어
- 简体中文
- 繁體中文
- Bahasa Indonesia
- Bahasa Melayu
- ไทย
- Tiếng Việt
- हिंदी
Why Aren't We Seeing A Resource Stock Rally?
Published 12/17/2012, 04:16 AM
Updated 07/09/2023, 06:31 AM
Why Aren't We Seeing A Resource Stock Rally?
Latest comments
Loading next article…
Install Our App
Risk Disclosure: Trading in financial instruments and/or cryptocurrencies involves high risks including the risk of losing some, or all, of your investment amount, and may not be suitable for all investors. Prices of cryptocurrencies are extremely volatile and may be affected by external factors such as financial, regulatory or political events. Trading on margin increases the financial risks.
Before deciding to trade in financial instrument or cryptocurrencies you should be fully informed of the risks and costs associated with trading the financial markets, carefully consider your investment objectives, level of experience, and risk appetite, and seek professional advice where needed.
Fusion Media would like to remind you that the data contained in this website is not necessarily real-time nor accurate. The data and prices on the website are not necessarily provided by any market or exchange, but may be provided by market makers, and so prices may not be accurate and may differ from the actual price at any given market, meaning prices are indicative and not appropriate for trading purposes. Fusion Media and any provider of the data contained in this website will not accept liability for any loss or damage as a result of your trading, or your reliance on the information contained within this website.
It is prohibited to use, store, reproduce, display, modify, transmit or distribute the data contained in this website without the explicit prior written permission of Fusion Media and/or the data provider. All intellectual property rights are reserved by the providers and/or the exchange providing the data contained in this website.
Fusion Media may be compensated by the advertisers that appear on the website, based on your interaction with the advertisements or advertisers.
© 2007-2024 - Fusion Media Limited. All Rights Reserved.
