Over half of the world’s crude oil reserves are in the Middle East. Two benchmarks are the pricing mechanisms for oil producers and consumers around the globe. The price of West Texas Intermediate crude is the standard for the energy commodity produced in the United States, the most significant producer. According to the most recent data from the Energy Information Administration, U.S. output has been running at 13.1 million barrels per day, which is a record peak and higher than the two other leading producers; Saudi Arabia and Russia.
Brent crude oil is the benchmark for the energy commodity that comes from Europe, Africa and the Middle East. The international oil cartel, OPEC, is an organization that works together in an attempt to control the price of the energy commodity by establishing output quotas. At the late 2019 OPEC meeting, the oil ministers, along with Russia, increased the production cut from 1.2 to 1.7 million barrels per day. Saudi Arabia threw in another 400,000 barrels to lift the reduction to 2.1 million barrels. The cartel agreed to meet again in early March to assess the impact of its production reduction.
The risk-off conditions in markets across all asset classes on the back of the spread of coronavirus sent the price of oil lower, stocks and a host of other markets lower at the end of February. On Tuesday, March 3, the US Fed, in an emergency move, slashed the short-term Fed Funds rate by 50 basis points to 1.00%-1.25%. By Friday, March 6, OPEC shocked markets by not following the Fed in the face of weak global demand. The United States Oil Fund (NYSE:USO) tracks the price of WTI futures while the United States Brent Oil Fund (NYSE:BNO) moves higher and lower with the price of the Brent benchmark. When oil futures markets opened on Sunday night, the only word to describe the price action was carnage.
Oil Plunged As Coronavirus Created Risk-Off Conditions
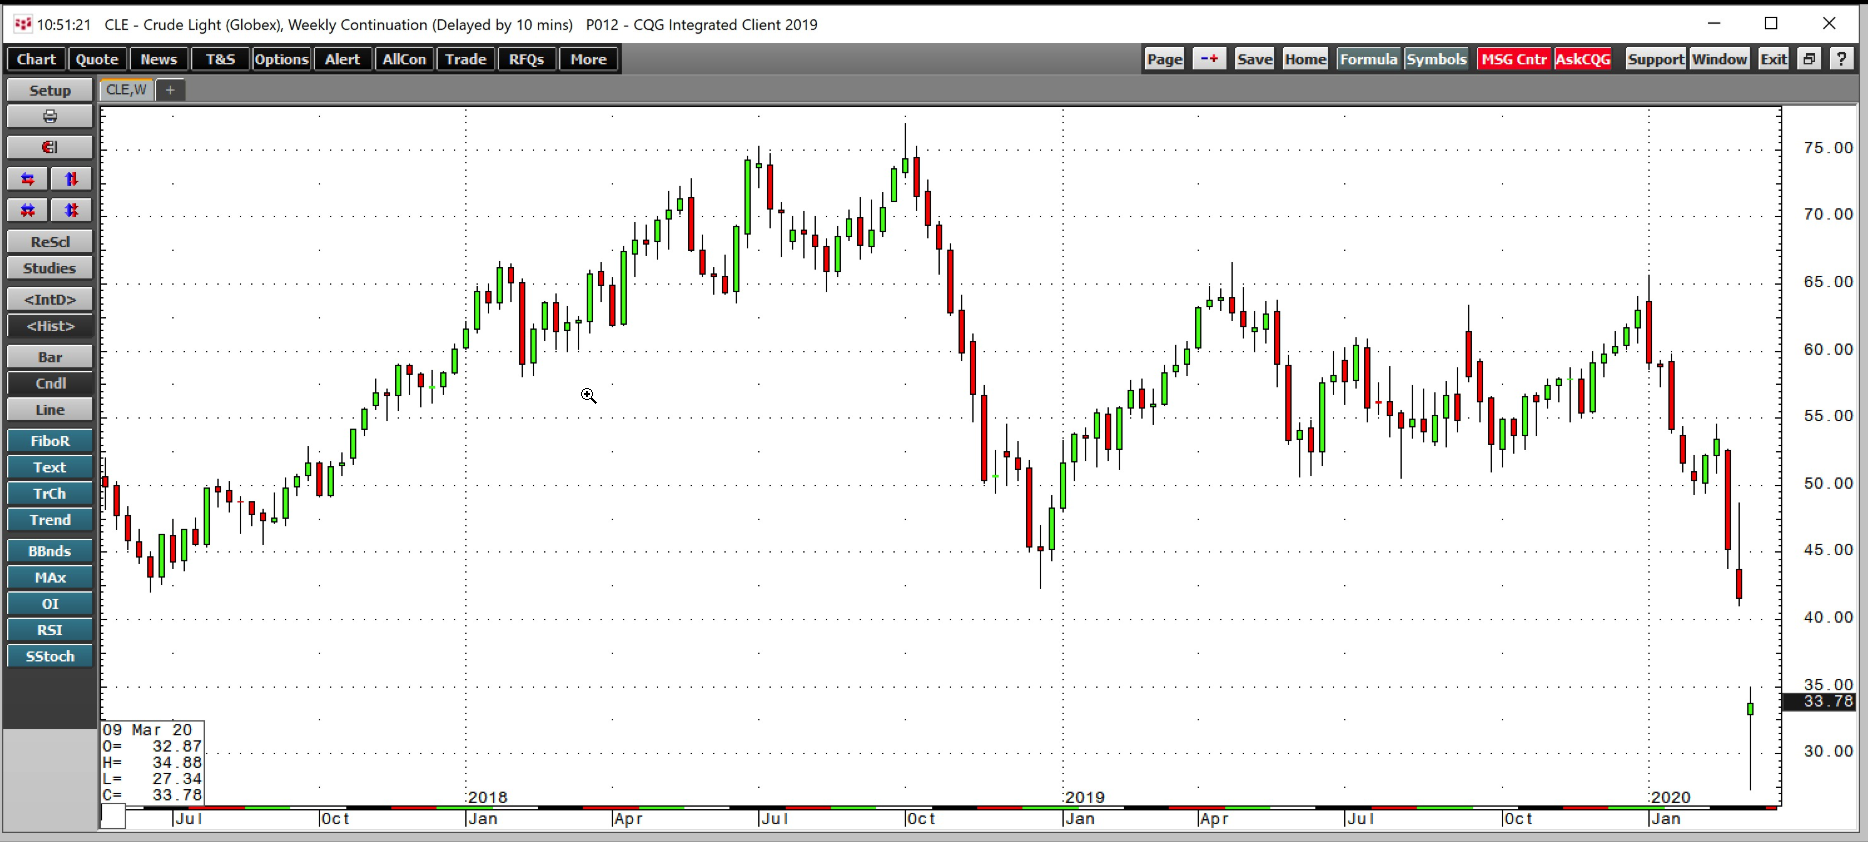
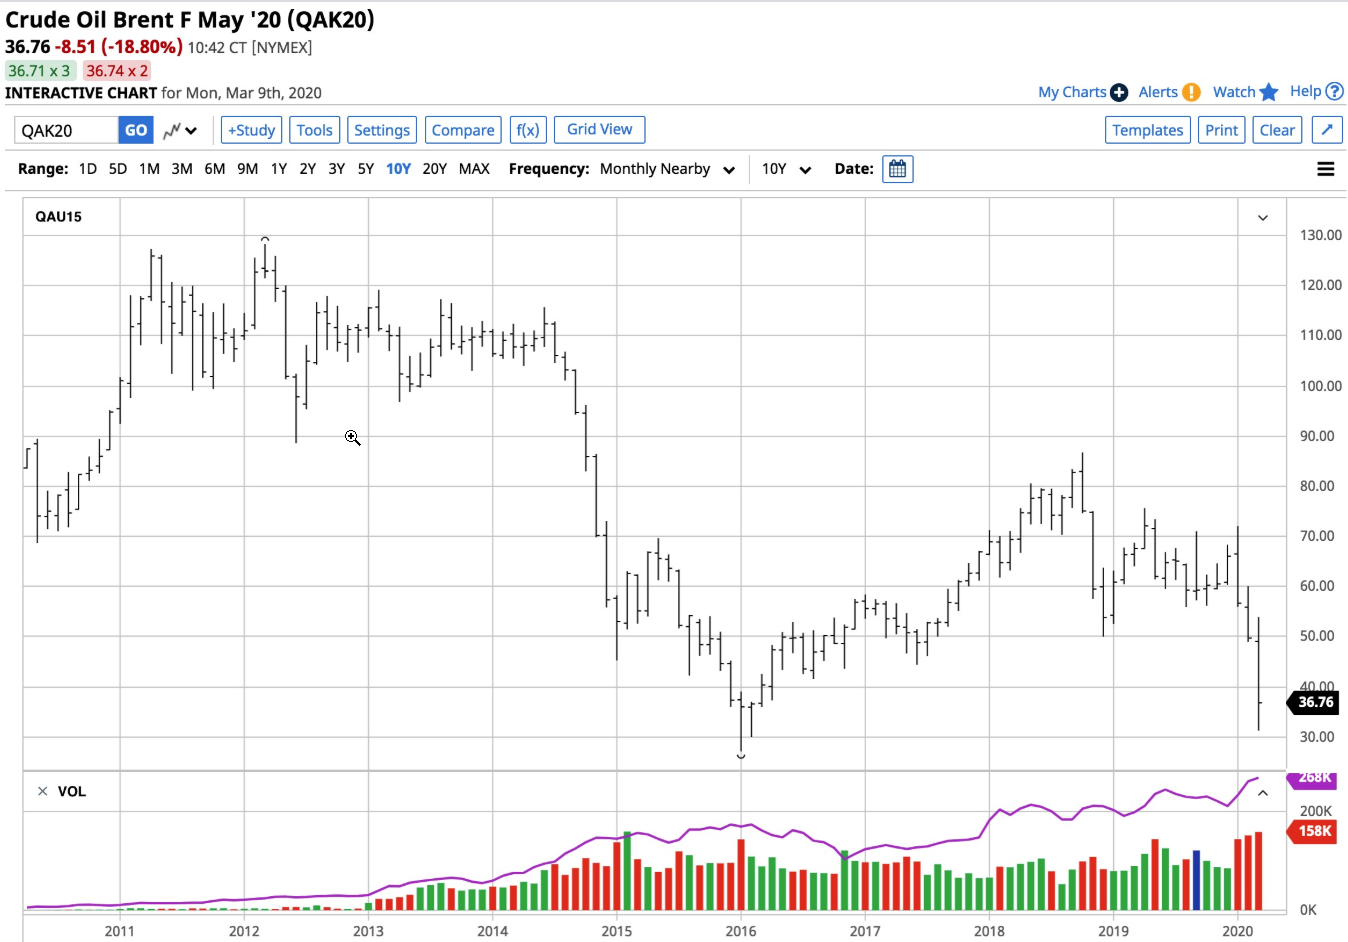
For a very brief time in January, optimism returned to the crude oil market when the U.S. and China signed a “phase one” trade deal that de-escalated the trade war. OPEC had cut production in late 2019 on the back of fears that trade issues between the nations with the world’s leading GDPs would cause a global recession. At the same time, crude oil rose to a high at $65.65 on WTI futures and $71.99 on nearby Brent futures on January 8 when tensions between the U.S. and Iran reached a boiling point in the Middle East. When the situation calmed, crude oil began to decline, but on January 15, the day that the U.S. and China signed the initial trade agreement in Washington DC, the price of the nearby crude oil futures contracts settled at around $58 on WTI and $64 on Brent futures.
In January, the outbreak in coronavirus began in China. In February, it spread to other countries around the world. During the final week of February, risk-off conditions gripped markets across all asset classes. The price of NYMEX futures fell below $50 per barrel, and Brent did the same.
OPEC Watches Price Of Brent Futures
The U.S. Federal Reserve responded to the risk-off conditions with an emergency 50 basis point cut in the Fed Funds rate on March 3. The oil market waited for a word from OPEC at the end of last week. The members met on March 5, and OPEC plus one, which included Russia, on Friday, March 6.
OPEC monitors the benchmark Brent futures price. At past meetings, oil ministers stated that the sweet spot for the price of Brent crude was between $60 and $70 per barrel. As the meeting got underway with the price below the bottom end of the target band, the market anticipated a one million barrel per day addition to production cuts. Saudi Arabia told the world they favored a deeper 1.5 million barrel per day reduction from the current level.
No Move To Balance The Market By International Oil Cartel
The bottom line on last week’s OPEC plus one meeting was that the Russians refused to agree to anything more than a 500,000-barrel additional output cut. Russia claimed that there is not enough information on coronavirus to justify a significant reduction in output. The meeting ended on March 6 with no agreement, which fueled the falling knife in the oil futures arena. Saudi Arabia decided to flood the market with the energy commodity.

(Source: CQG)
The chart highlights that the price of oil fell to a low of $41.05 per barrel last Friday, 37.5% below the January 8 high, and to the lowest level since August 2016. On Sunday night, the crude oil market tanked to a low of $27.34 per barrel, another 33.4% below the March 6 low.

(Source: Barchart)
The Brent futures dropped from its early January high of $71.99 to last Friday’s low of $45.16 or 37.3%. Brent fell to the lowest level since November 2016. On Sunday evening, Brent fell to a low of $31.25, 30.8% below Friday’s low. The crude oil market had been a falling knife, but OPEC’s refusal to acknowledge the impact of the virus sent the price of WTI and Brent to the lowest levels since early 2016. Technical support for the two crude oil benchmarks is now at $26.05 and $27.11 per barrel, the February 2016 lows.
The Fed cut interest rates in response to Coronavirus, but OPEC did not follow with a reduction in production. Crude oil became a falling knife. As the lower price of crude oil will further reduce inflationary pressures, it creates room for even further interest rate declines in the U.S. and around the world. The current bearish environment of fear and uncertainty got another bearish kick in the pants from Russia last week. Crude oil is still the commodity that powers the world, and that will not change over the coming days, weeks, or months. Meanwhile, the move in crude oil is likely to have significant ramifications for markets across all asset classes. The price was back around $34 per barrel on the nearby NYMEX futures contract on Monday in highly volatile trading conditions. Be careful!
The United States Natural Gas Fund L.P. was trading at $13.20 per share on Monday afternoon, down $0.12 (-0.90%). Year-to-date, UNG has declined -43.40%, versus a 5.77% rise in the benchmark S&P 500 index during the same period.
UNG currently has an ETF Daily News SMART Grade of C (Neutral), and is ranked #51 of 109 ETFs in the Commodity ETFs category.
