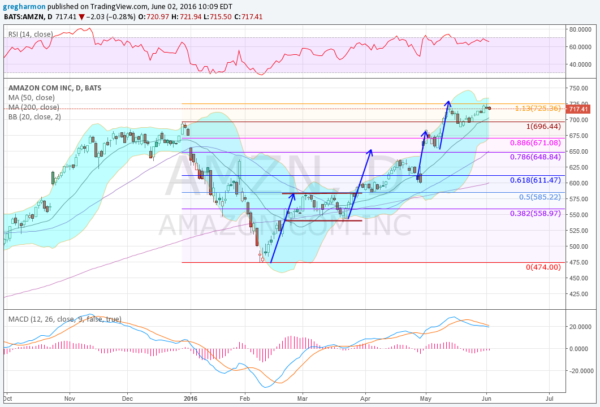
Amazon (NASDAQ:AMZN) pulled back with the market to start the year. By mid February it had lost 32% of its market cap. This was after posting blow out earnings. The narrative was that it had come too far too fast. Ok, whatever.
Since that pullback the stock has moved higher in 4 steps. 3 weeks ago it moved to a new all-time high, retracing 113% of the downward move. The chart below shows this led to a pullback to the prior high and then a new leg up. It now sits at the all-time high consolidating. What will be the next move?

The chart shows the momentum waning. The RSI is in the bullish zone but moving sideways. The MACD is pulling back but starting to level. No real weakness to sell on but maybe more of a pause. The SMA’s are continuing higher and the Bollinger Bands® are shifted higher. Definitely an upward bias but maybe not right away.

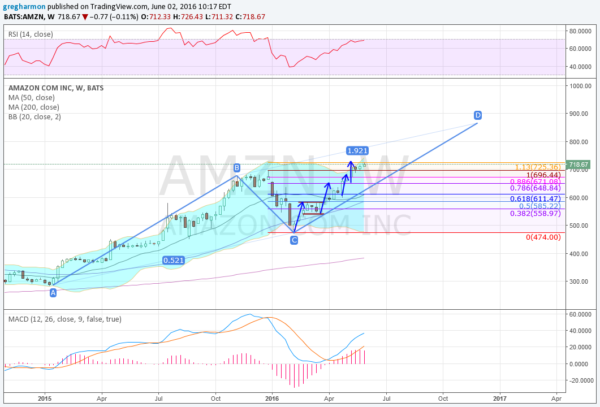
It is the weekly chart that may be keeping it and shareholders smiling right now. Pulling back to the longer view there is now an AB=CD pattern that has built. It gives a target to about 865 at the end of November. And on this longer view the RSI is rising along with the MACD, both bullish. The Bollinger Bands are opening higher as well. Nothing to fear on the longer chart. In fact plenty to smile about.
DISCLAIMER: The information in this blog post represents my own opinions and does not contain a recommendation for any particular security or investment. I or my affiliates may hold positions or other interests in securities mentioned in the Blog, please see my Disclaimer page for my full disclaimer.
