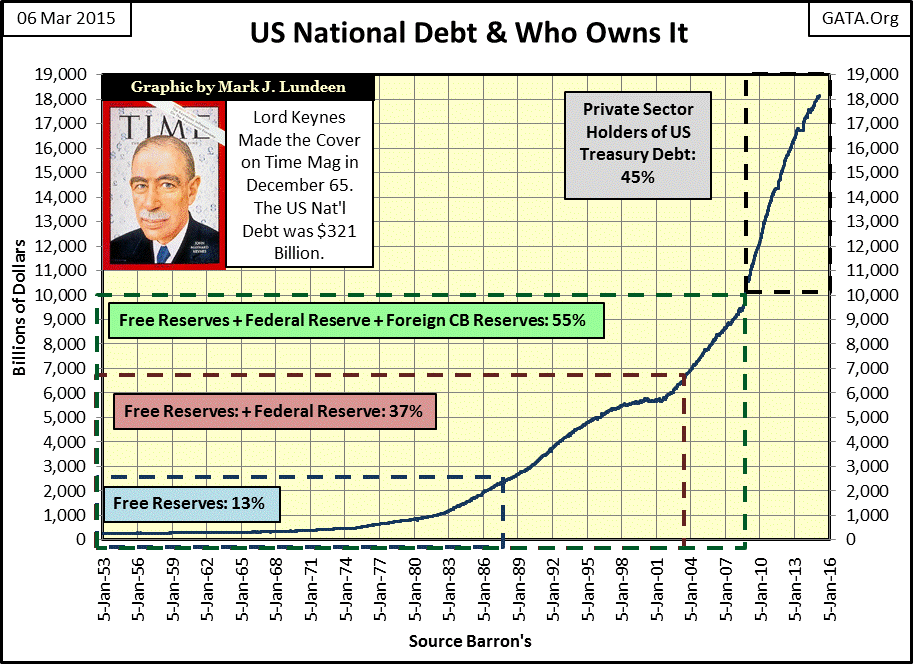
Uncle Sam likes spending money; whether from taxes or sales of Treasury debt, it’s all the same to him. By December of 1952 the US Treasury had accumulated $262 billion dollars in debt, a shocking sum at the time. Now, seven decades later Uncle Sam has borrowed and spent $18.13 TRILLION DOLLARS of other peoples’ money in a highly successful effort to keep Washington’s entrenched interests happily entrenched.
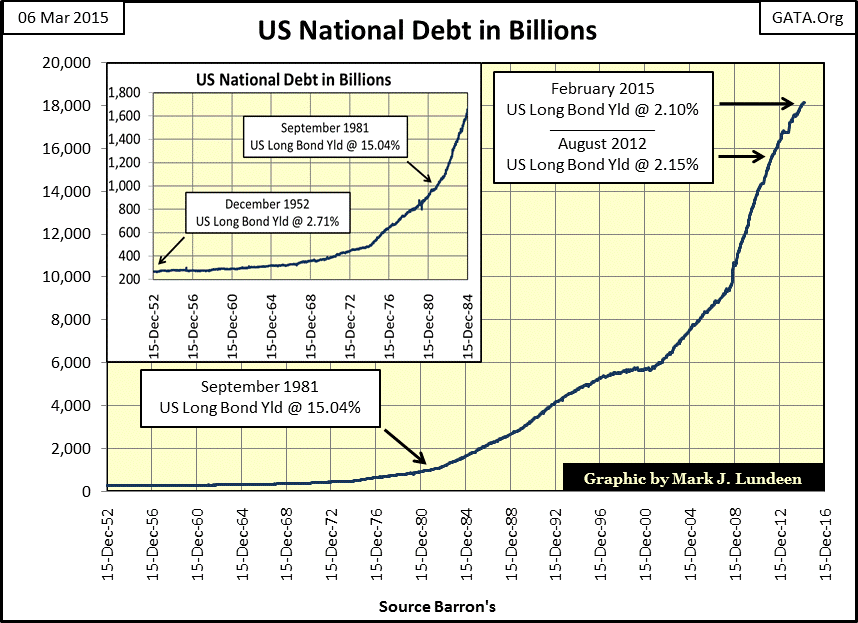
Future economic historians will be called on to explain how interest rates have managed to declinesince 1981 from 15% on US Treasury bonds to levels below those of 1952, even as the US Treasury’s debt load soared.
This is even more remarkable as the double digit interest rates in 1981 were the market’s punishment for the US Treasury increasing the national debt from $262 billion in 1952 to $1 trillion in 1981. After December 1981, interest rates reversed and declined below 1952 levels, even though the volume of US Treasury debt continued increasing by a factor of 18 to an astonishing new level of $18 trillion, with no end in sight.
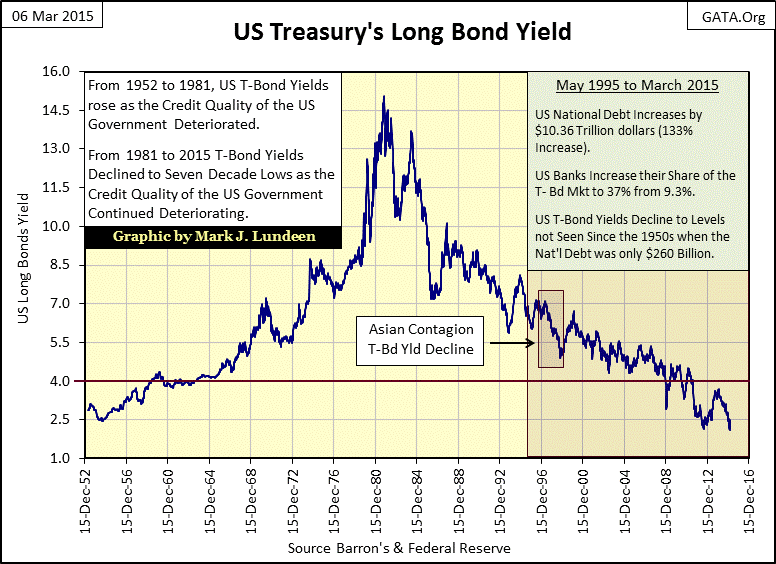
US Long-Bond Yields
It would seem that the trick of lowering T-Debt yields as the national debt continually rises has to do with who is purchasing the debt and what they are doing with it. As seen in the chart below central banks are huge owners of the national debt, and what they do with Treasury debt is “monetize” it. What exactly is debt monetization? The Fed (or other central bank) simply prints up some “pretend” money (actually it’s all done on a computer), and purchases bonds on the open market. This new“money” enters circulation and increases the money supply; the very definition of inflation.
The world is now drowning in unpayable debt and this is why; as the US government goes deeper into debt, banks have more “reserves” from which to make loans for Greek government bailouts or sub-prime auto loans. The problem with all this is that creating credit requires no capital or labor from the banking system. This is not the case with those who burden themselves with these new loans; their ability to repay their loans is limited by their income, and their lifespan.
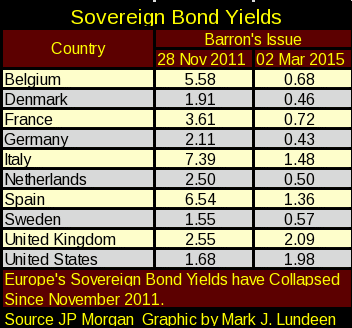
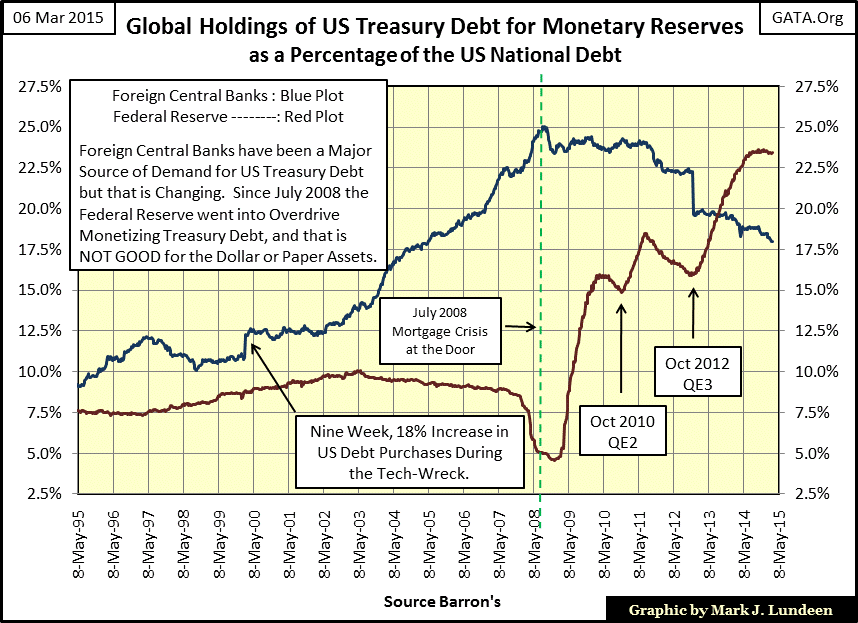
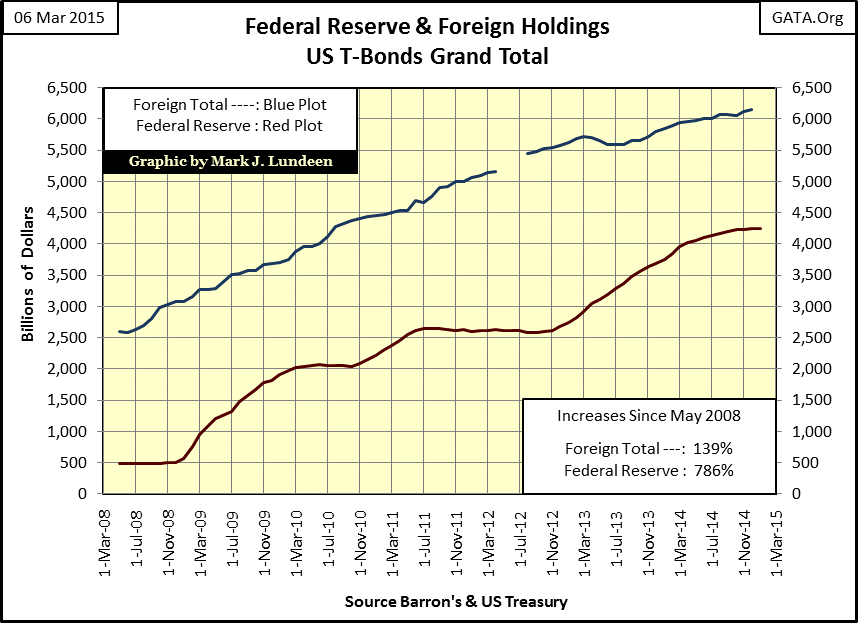
A lot of monetary history can be seen in my next chart, if not the specifics of which foreign central bank is purchasing Treasury debt. However it’s safe to assume that much of the overseas-mortgage mischief that has devastated European economies (China too) can be traced in the 2003-2011 increase in foreign-central bank holdings of Treasury debt shown in the blue plot below. The down gap in the blue plot occurred in November 2012. Since then the US Treasury portfolios of foreign central banks have remained relatively constant at 3.25 trillion dollars. From what I hear Europe’s central banks are now monetizing European sovereign debt as quickly as these governments can issue it. This is confirmed by the European sovereign bondyield collapse since November 2011.
The 2008 decline in the red plot below tells us exactly whenDoctor Bernanke became painfully aware of the sub-prime mortgage problem. He began exchanging the Federal Reserve’s Treasury debt reserves for Wall Street’s non-performing sub-prime mortgage assets that no other financial institution would touch.
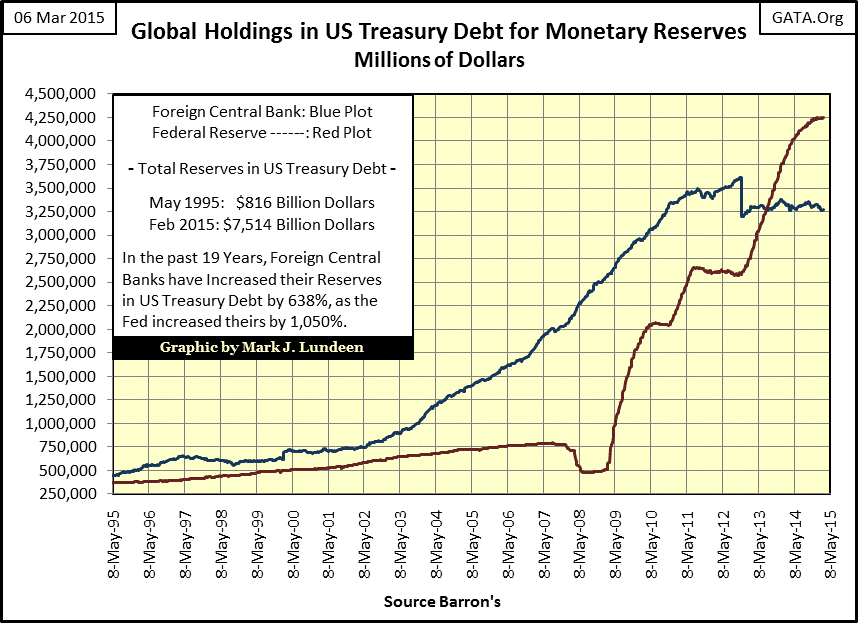
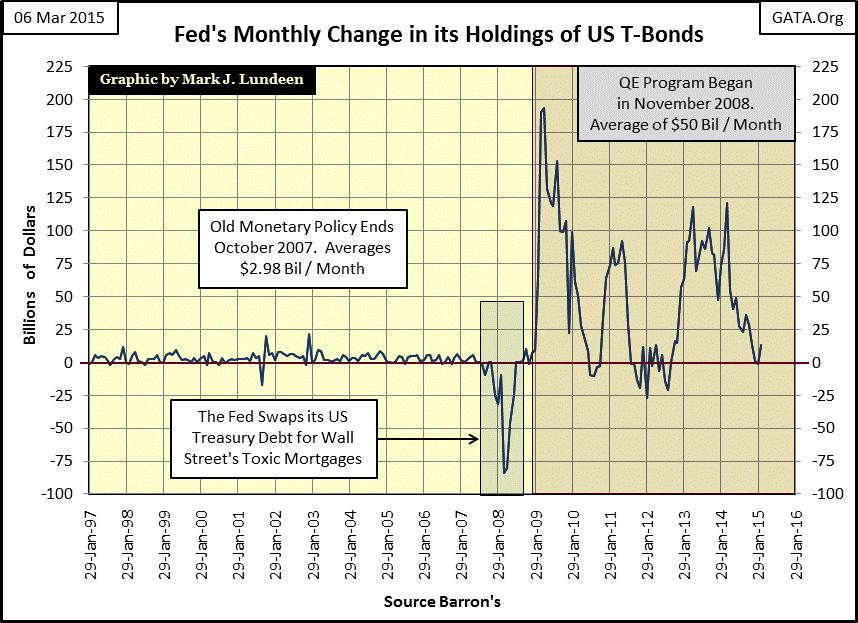
The three bouts of QE are very evident in the red plot above. In the chart below I’ve plotted the monthly change in the Fed’s US Treasury bond holdings. From January 1997 to October 2007 the Federal Reserve monetized on average 2.98 billion dollars of Treasury Debt per month. This may not sound like much in our current era where trillions-of-dollars is becoming a common term. However these decade long monthly expansions in the Fed’s balance sheet are what fueled the bubbles in high-tech stocks and sub-prime mortgages. The Federal Reserve’s post October 2007 reaction to the bursting of the mortgage bubble tells us just how dangerously leveraged America’s financial system was in 2007, (and still is eight years later).
The Fed’s first vain effort to bail out the banking system following the mortgage fiasco is seen in the 2008 down spike in its US Treasury bond holdings. Then, in March and April 2009, the Federal Reserve monetized over 190 billion dollars of the National Debt: a two month increase in the Federal Reserve’s balance sheet of $384 billion dollars. That’s some serious “policy making!” The Federal Reserve is currently keeping its monetizing impulses in check. But how long they will continue the policy of monetizing just a few billion dollars of Treasury debt a month depends on if they can continue inflating stock prices, and preventing bond yields from rising.
Returning to foreign central bank holdings of US Treasury debt, it appears that foreign central banks(Blue Plot below) have been selling US Treasury debt since 2008. But keep in mind this plot is a percentage of national debt. In fact since July 2008 these banks have increased their T-debt holdings by 920 billion dollars, a 39% increase. The blue plot has been declining since July 2008 (the beginning of the credit crisis)as the US national debt has been increasing faster than foreign-central banks have monetized it.But not so with the Federal Reserve, who since July 2008 has been monetizing US sovereign debt considerably faster than Congress and President Obama have been increasing it, trillions of dollars of debt Washington’s politicians haveno intention of ever paying off.
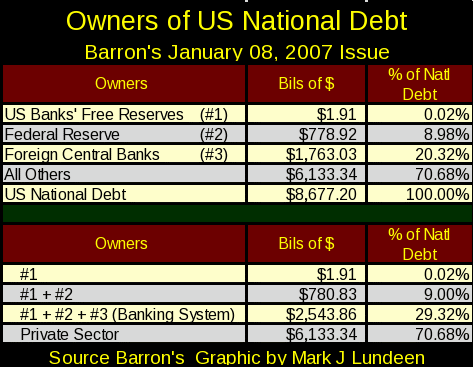
Here’s a table listing the US banking system’s Free Reserves,along with the Federal Reserve and foreign central bank holdings of US T-Debt from Barron’s 08 January 2007 issue.At the time, market yields for sub-prime mortgage securities were not far above those offered by US Treasury bonds, but because of massive defaults in the mortgage market in the coming yearthatwould soon change. In the table’s lower portion we see how eight years ago banks were holding 29.32% of the national debt, with 70.68% held by “the private sector;” individuals, pension funds and insurance companies around the world.
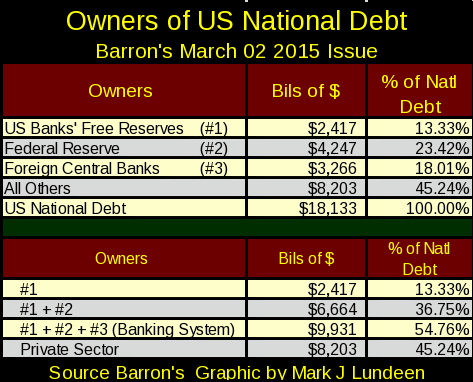
Things have changed since then as we see below. The increase in US banks’ free reserves has been shocking: over the past eight years (and three QEs) they’ve increased by a factor of 1,265!
The US banking system’s free reserves (#1 in the table above and chart below) now owns all of the national debt issued through 1988, as Ronald Reagan was preparing to leave the Whitehouse. Add in the Fed’s portfolio of Treasury debt (#1 + #2) and they have gobbled up allof the national debt in existence as of July 2003, half way through George W Bush’s first term. The US Treasury debt held by both domestic and foreign banks (#1 + #2 + #3) has absorbed all of the Treasury debt in existence as of September 2008 from the open market, leaving the private sector with just the amount of federal debt created since President Obama was elected in November 2008. This is insane. Rational people, (if not Doctors in Economics “managing” this insanity) understand that this is not sustainable.
It can’t be denied; the global banking system, led by the Federal Reserve is monetizing America’s national debt, even though Doctor Bernanke would have us, and Congress believe otherwise:
(When asked directly during congressional testimony if the Federal Reserve would monetize U.S. government debt, the Fed Chairman responded) "The Federal Reserve will not monetize the debt."
- Doctor Benjamin Bernanke; June 03, 2009
It was a lie, a lie Congress expected to hear, a lie that for everyone who matters in Wall Street and Washington knew would be passed on by the financial media to a gullible public as if it was the gospel truth. Doctor Bernanke had to fib a lot as Fed Chairman, but every now and then he would tell the truth, as in the second part of the quote below.
"One myth that’s out there is that what we’re doing is printing money. We’re not printing money. --- The money supply is not changing in any significant way. What we’re doing is lowering interest rates by buying Treasury securities."
- Doctor Benjamin Bernanke; December 05, 2010
The US Government certainly * IS *printing money. Currency in Circulation has increased 71% since Bernanke took over as Fed Chairman in the spring of 2006. But to be fair the 3.6 trillion dollar expansion in the Fed’s balance sheet since January 2007, and the trillions more dollars of credit extended to failing banks worldwide since 2007 didn’t really involve printing anything on paper, but was accomplished using silicon chips and hard drives.
The data above is provided by the Federal Reserve, but the US Treasury also publishes data on who owns US Treasury debt. The blue plot below shows the total ownership of US Treasury Debt held by foreign interests; the red plot is the Federal Reserve’s portfolio of US Treasury debt. Data is current up to December 2014.
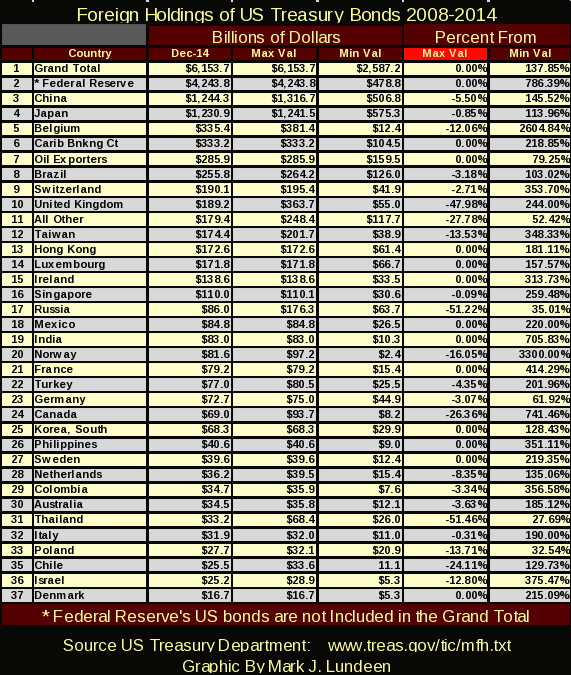
This next table is sorted by who owns these Treasury bonds, by largest holders to smallest in the column labeled: Dec 14, the most recent data available. The data for the Federal Reserve is not provided by the US Treasury, but I include it as it’s pertinent.
The Max Val column lists the largest quantityof T-debt each country has held since May 2008; the Min Val columnlists the minimum since May 2008. Back in May 2008 both China and Japan owned more US Treasury debt than did the Federal Reserve. That is no longer the case. The highlighted Max Val column lists the percentage difference of the most recent data (December 2014) is from its all-time high. A max value of 0.00% means that the country’s holding of T-Debt is at an all-time high as of December 2014. The Min Val shows the percentage increase in the country’s portfolio of Treasury Bonds from its all-time low.
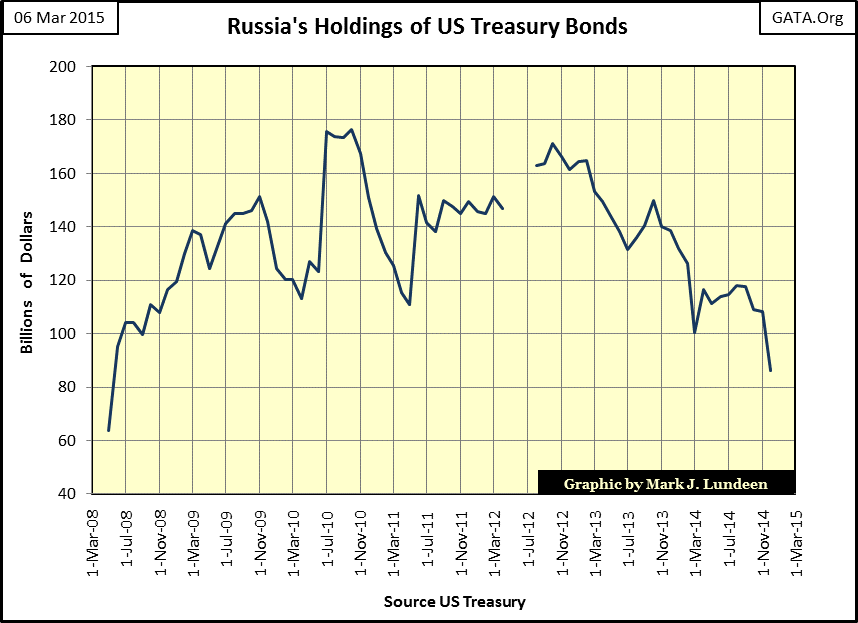
Last year there was much talk about Russia disrupting the American economy by selling off their US Treasury Bonds. But currently Russia (chart below and #17 in table above) has only 86 billion dollars of US Treasury bonds left. Janet Yellen’s FOMC could monetize that in just a few hours.
However if China (#3 in the table above and chart below) ever decided to sell its trillion dollar portfolio of T-bonds, it could cause big problems in financial markets, as it would require an entirely new round of QE by the Federal Reserve to monetize all of China’s Treasury bond holdings.
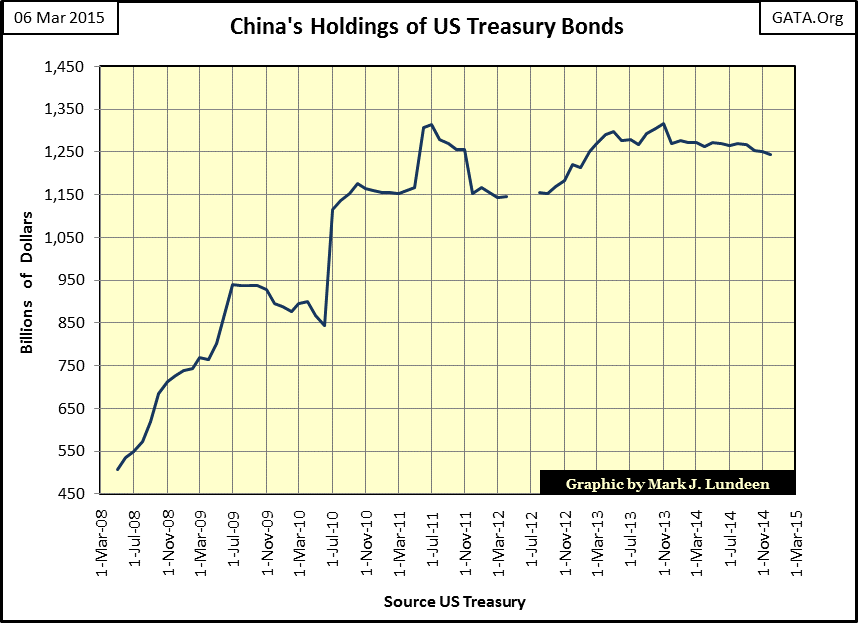
That being said, it doesn’t seem likely that China would want to be seen as the cause of a new international economic disruption. Although they might not mind inflicting pain on Washington and Wall Street, being blamed for causing economic pain in other countries is not in their best interest. What China does want, I think, is to replace the United States as the center of international economic power.
So China has wisely stopped accumulating US Treasury debt. Dumping US debt, while tempting, would only cause China to be blamed for the coming debacle. The wise move for China is to continue playing the waiting game; continuing to accumulate gold and silver while producing goods for sale on international markets.
