Whiting Petroleum Corporation (WLL) is an independent oil and gas company engaged in acquisition, development, exploitation, production and exploration activities primarily in the Rocky Mountains, Permian Basin, Mid-Continent, Michigan and Gulf Coast regions of the United States.
This is an interesting one where the vol is imploding while the stock is starting to make a run up. I found WLL using a real-time custom scan that hunts for depressed vols.
Custom Scan Details
Stock Price GTE $5
IV30™ GTE 20
IV30™ Percentile LTE 10
Average Option Volume GTE 1,200
The goal with this scan is to identify short-term implied vol (IV30™) that is depressed to its own annual history (at most in the 10th percentile). I'm also looking for a reasonable amount of liquidity in the options (thus the minimum average option volume), and I want a minimum vol level so I don't pick up any boring ETFs (or whatever). The stock price requirement helps me identify names that have enough strike prices to trade or spread.
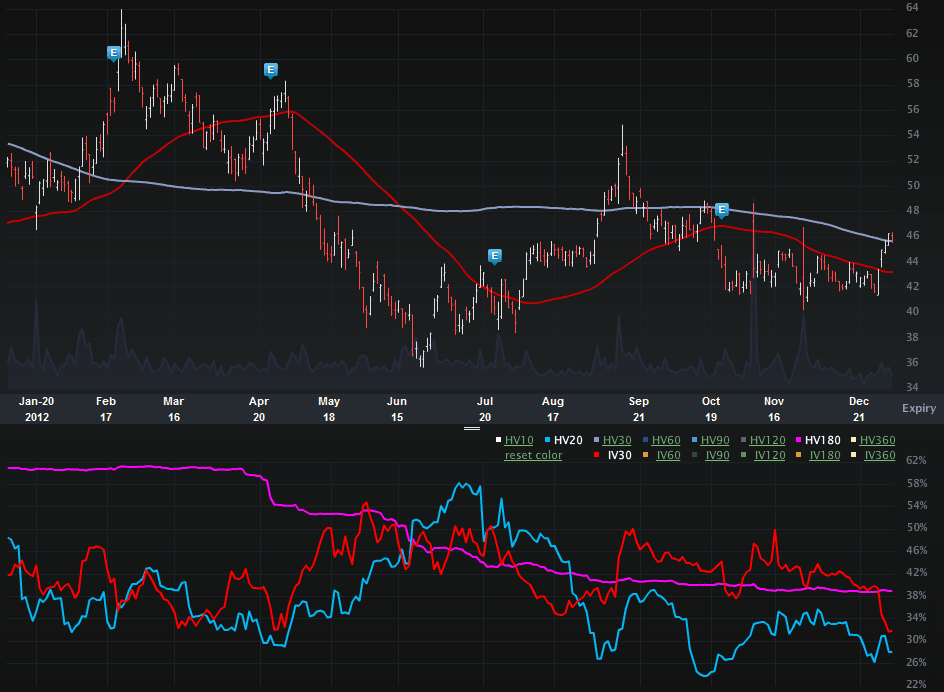
The WLL one-year Charts Tab is included (below). The top portion is the stock price the bottom is the vol (IV30™ - red vs HV20™ - blue vs HV180™ - pink).
On the stock side we can see how the price has fallen from the mid $60 range in early 2012, to as low as the mid $30 range in the summer. More recently however, we can see the stock rise from $41.67 (12-28-2012) to now just under $46. The 52 wk range for the stock is [$35.68, $63.97].
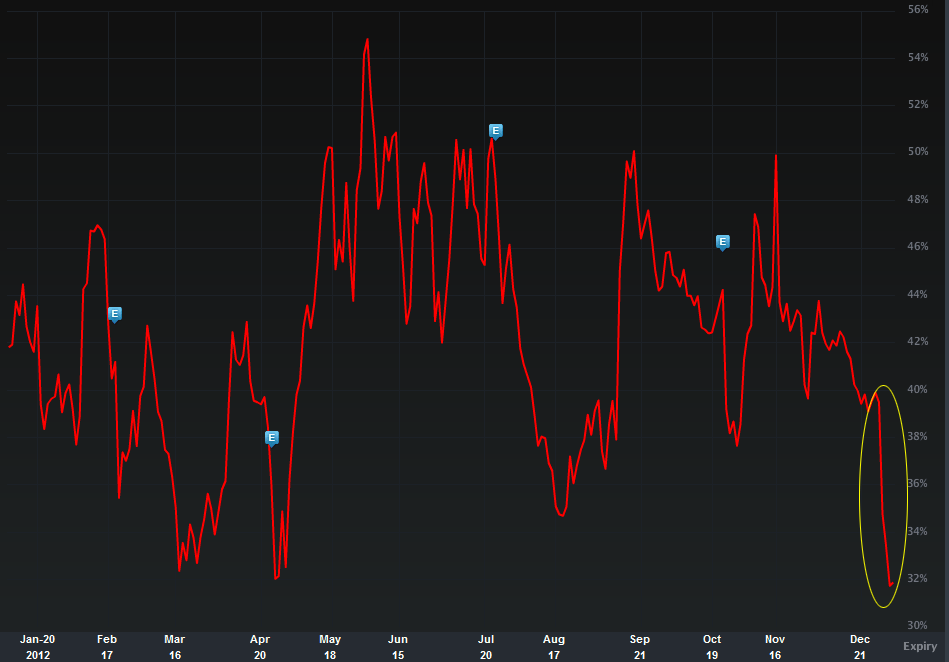
But, of course, this is a vol note, so I've included a one-year chart of the IV30™ in isolation, below.
We can see how much the implied has collapsed in the last few trading days (highlighted in yellow) as the stock has been climbing. The 52 wk range in IV30™ is [31.74%, 54.81%], putting the current level in the 1st percentile (annual). In English, this stock is popping as IV30™ is reaching a new annual low.
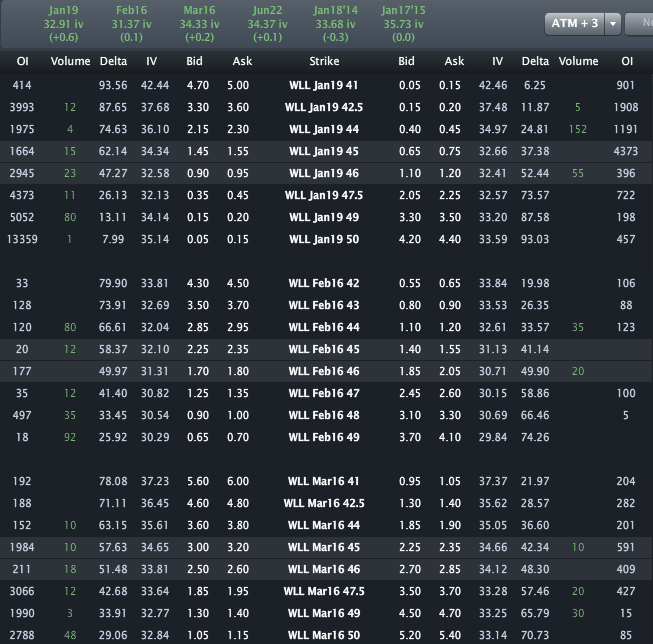
Finally, let's look to the Options Tab (below).
We can see across the top the monthly vols are priced to 32.91%, 31.37% and 34.33%. I note the Mar vol b/c that expiry should have an earnings release embedded in it. Continuing the motif I started last week, simply asking, "should vol be at annual (or multi-year) lows right now?" For this stock, we can add the observation that the price is up ~10% in the last couple of weeks.
Disclosure: This is trade analysis, not a recommendation.
Images provided by Livevol®
- English (UK)
- English (India)
- English (Canada)
- English (Australia)
- English (South Africa)
- English (Philippines)
- English (Nigeria)
- Deutsch
- Español (España)
- Español (México)
- Français
- Italiano
- Nederlands
- Português (Portugal)
- Polski
- Português (Brasil)
- Русский
- Türkçe
- العربية
- Ελληνικά
- Svenska
- Suomi
- עברית
- 日本語
- 한국어
- 简体中文
- 繁體中文
- Bahasa Indonesia
- Bahasa Melayu
- ไทย
- Tiếng Việt
- हिंदी
Whiting Petroleum: Vol Nears Annual Low As Stock Continues To Rise
Published 01/08/2013, 02:49 AM
Updated 07/09/2023, 06:31 AM
Whiting Petroleum: Vol Nears Annual Low As Stock Continues To Rise
Latest comments
Loading next article…
Install Our App
Risk Disclosure: Trading in financial instruments and/or cryptocurrencies involves high risks including the risk of losing some, or all, of your investment amount, and may not be suitable for all investors. Prices of cryptocurrencies are extremely volatile and may be affected by external factors such as financial, regulatory or political events. Trading on margin increases the financial risks.
Before deciding to trade in financial instrument or cryptocurrencies you should be fully informed of the risks and costs associated with trading the financial markets, carefully consider your investment objectives, level of experience, and risk appetite, and seek professional advice where needed.
Fusion Media would like to remind you that the data contained in this website is not necessarily real-time nor accurate. The data and prices on the website are not necessarily provided by any market or exchange, but may be provided by market makers, and so prices may not be accurate and may differ from the actual price at any given market, meaning prices are indicative and not appropriate for trading purposes. Fusion Media and any provider of the data contained in this website will not accept liability for any loss or damage as a result of your trading, or your reliance on the information contained within this website.
It is prohibited to use, store, reproduce, display, modify, transmit or distribute the data contained in this website without the explicit prior written permission of Fusion Media and/or the data provider. All intellectual property rights are reserved by the providers and/or the exchange providing the data contained in this website.
Fusion Media may be compensated by the advertisers that appear on the website, based on your interaction with the advertisements or advertisers.
© 2007-2025 - Fusion Media Limited. All Rights Reserved.
