Whilst FedEx Sounds The Alarm For Global Trade, Can UBS Weather The Storm?

Published 09/24/2019, 01:02 AM
FDX
-
UPS
-
DJT
-
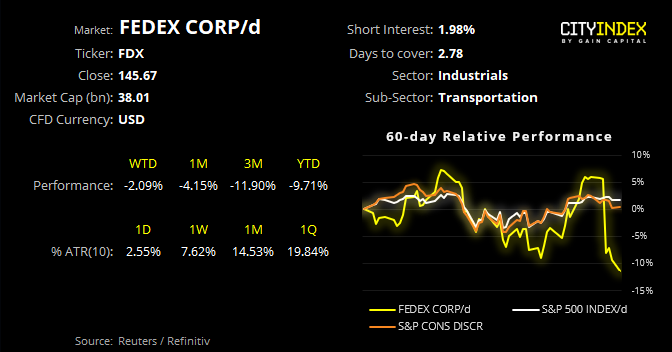
Fedex Corp/D Performance Chart

Whilst FedEx Corporation (NYSE:FDX) is on the brink of breaking key support, United Parcel Service Inc (NYSE:UPS) is just 4% from its YTD. Disappointing earnings and a lowered full-year outlook saw FedEx plummet over -10% at market open last Tuesday, and it was the main reason behind the Dow Jones Transportation sell-off whilst also triggering fresh concerns for the global economy.
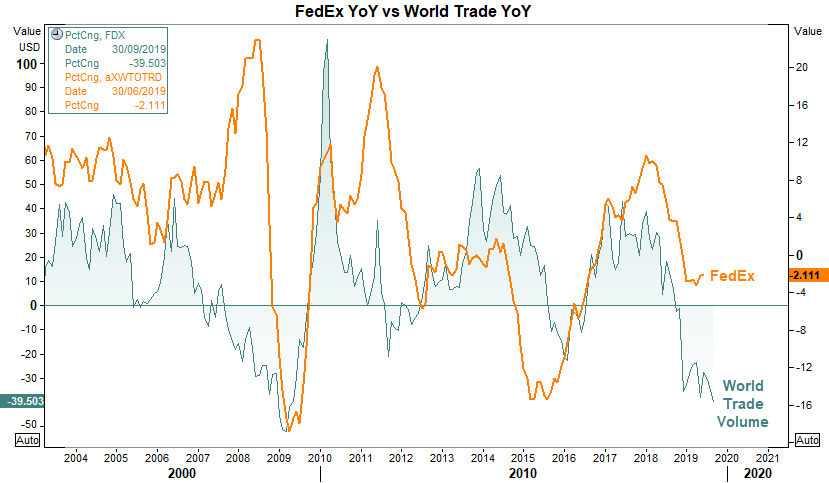
FedEx YoY vs World Trade YoY

We can see that FedEx (NYSE:FDX) performance can be taken as a bellwether for global trade by comparing the YoY% of FedEx with YoY Trade volume. Whilst the correlation is not perfect, its still a decent enough proxy and would suggest that global trade is to drop further (and therefor, global growth and potential for further easing from central bankers).
FedEx Corp Daily Chart

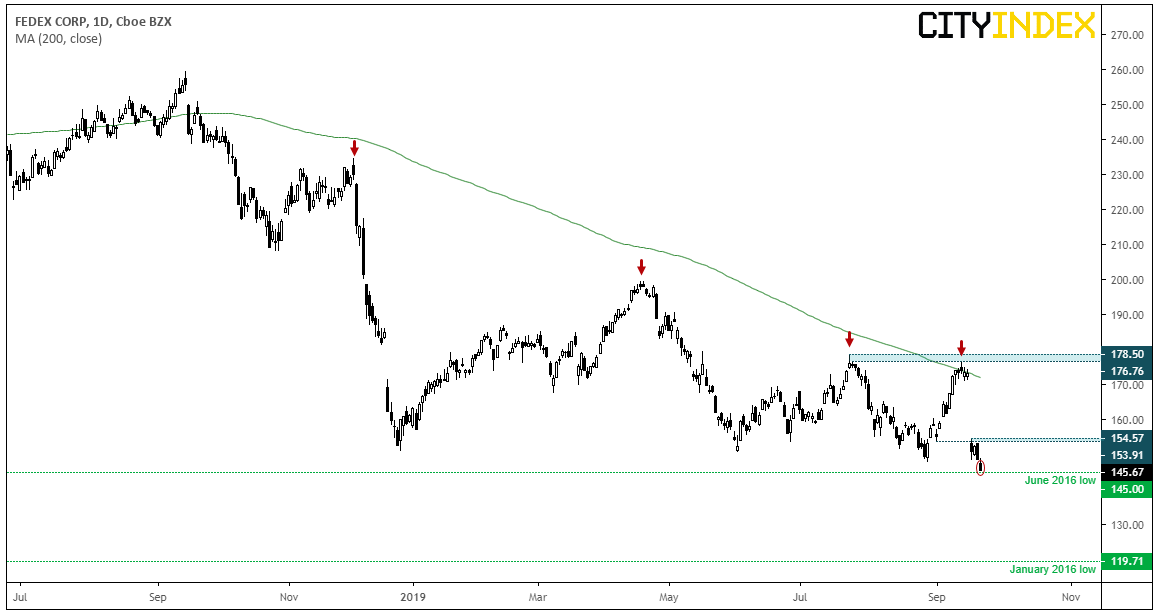
Looking at the daily FedEx (NYSE:FDX) chart, prices has been oscillating between 148 – 178 since June, although the 200-day average capped as resistance near the top of the range before rolling over to the low of the range. In fact, FedEx closed to a 3-year low yesterday and sits just ticks above key support.
  • Given the series of lower highs and pick-up of bearish momentum, we’re waiting for prices to break the June 2016 low to signal a resumption of the bearish trend.
  • Bearish target is around 120 (just above the January low).
  • Whilst the trend remains bearish below 176.76, we’d step aside with a break above 154.57 as it warns of a corrective bounce from key support. We’d then look to reassess the potential for a short trade if a new lower high is created, beneath 176.76.
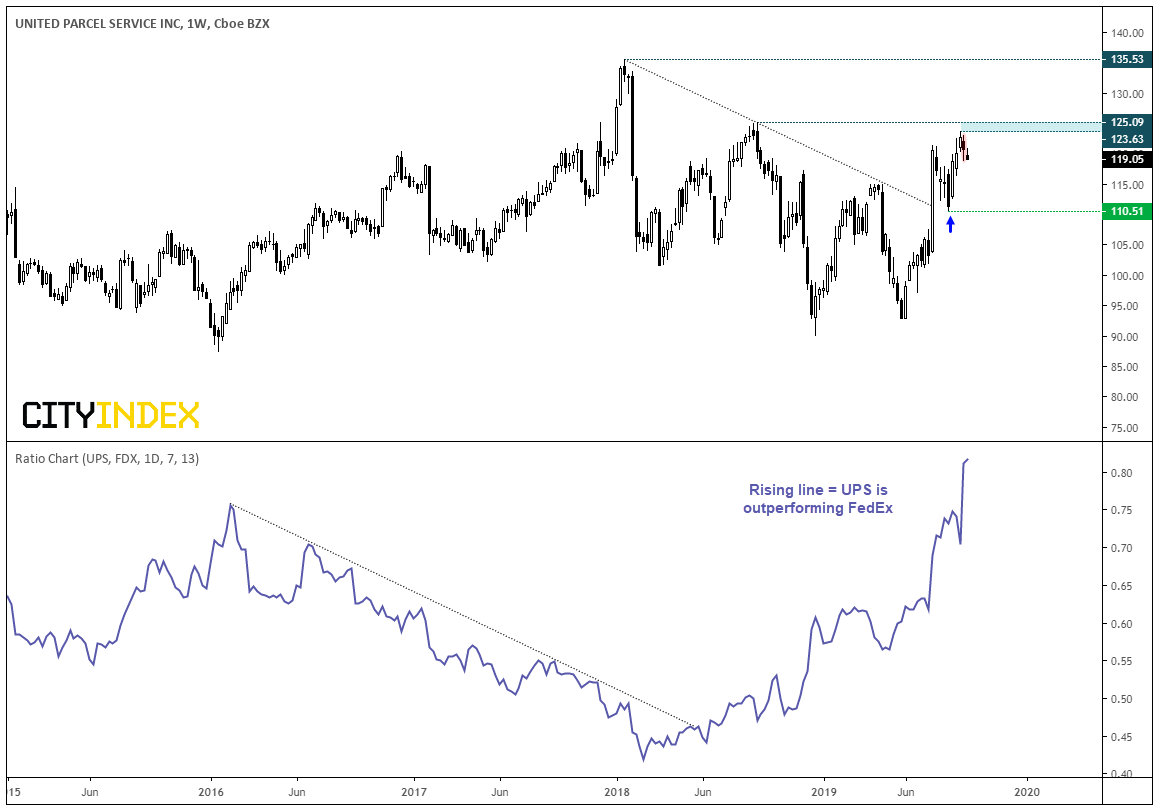
  • United Parcel Service Inc Weekly Chart

    Interestingly, their rival UPS isn’t facing the same headwinds with the stock trading just 4% from this year’s highs. Still, it’s failed to retest the 125 high so there is potential for this one to roll over too. But perhaps another way to look at this is as an inter-sector pairs trade, given the ratio between UPS/FDX has been rising sharply.

  • Looking at the weekly chart, USD has outperformed FDX on a relative basis since early 2018 when the ratio broke above its bearish trendline. Given the ratio is rising rapidly, there could still be some juice left for this pair.
  • Last week’s bearish elongated Doji warns of near-term weakness, yet the stock continues to outperform Fedex on a relative basis
  • Price action on UPS broke above its bearish correction line in July and continues to print higher lows to show the trend is bullish.
  • A break above 125 assumes bullish continuation, whilst the potential for a deeper correction remains whilst it trades below 123.63
  • Original Post

    Latest comments

    Loading next article…
    Risk Disclosure: Trading in financial instruments and/or cryptocurrencies involves high risks including the risk of losing some, or all, of your investment amount, and may not be suitable for all investors. Prices of cryptocurrencies are extremely volatile and may be affected by external factors such as financial, regulatory or political events. Trading on margin increases the financial risks.
    Before deciding to trade in financial instrument or cryptocurrencies you should be fully informed of the risks and costs associated with trading the financial markets, carefully consider your investment objectives, level of experience, and risk appetite, and seek professional advice where needed.
    Fusion Media would like to remind you that the data contained in this website is not necessarily real-time nor accurate. The data and prices on the website are not necessarily provided by any market or exchange, but may be provided by market makers, and so prices may not be accurate and may differ from the actual price at any given market, meaning prices are indicative and not appropriate for trading purposes. Fusion Media and any provider of the data contained in this website will not accept liability for any loss or damage as a result of your trading, or your reliance on the information contained within this website.
    It is prohibited to use, store, reproduce, display, modify, transmit or distribute the data contained in this website without the explicit prior written permission of Fusion Media and/or the data provider. All intellectual property rights are reserved by the providers and/or the exchange providing the data contained in this website.
    Fusion Media may be compensated by the advertisers that appear on the website, based on your interaction with the advertisements or advertisers.
    © 2007-2025 - Fusion Media Limited. All Rights Reserved.