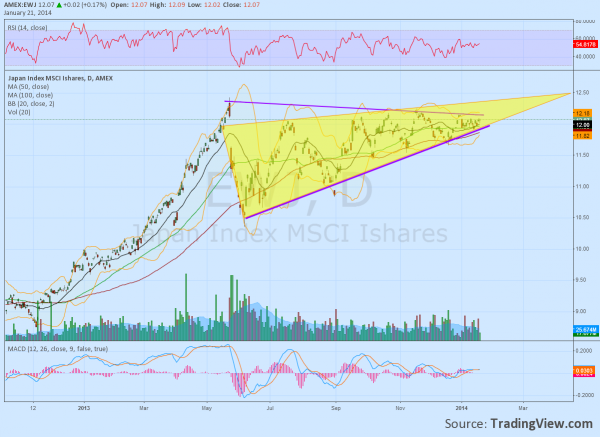
The Japanese stock market had a incredible run in 2013. If you look at the iShares Japan ETF, (EWJ), you'll see it moved up from a base at about 9 to a high of over 12.30. That is over 36%.
The Nikkei, without the tie back to the US dollar, did even better—up over 100%. When you look at the chart of the EWJ below it seems technically ready to move again in 2014, and in a big way. The question is which way will it go?
There are two ways to interpret the price action below. The first is by looking at the yellow triangle and calling it a rising wedge. This is often interpreted as a bearish reversal in the making. But there needs to be a break below the bottom of the wedge before it can be relied upon.
The second way to view this is that there is a Symmetrical Triangle, shown by the purple lines.

This shows a tightening and a resolution imminent on a break either way. The other indicators lean a bit to the upside right now. The RSI is above 50, so bullish, and the MACD is positive.
Will it break higher? The Nikkei itself is doing so. It does appear that we will find out soon.
Disclosure: I have owned shares in the EWJ ETF. The information in this blog post represents my own opinions and does not contain a recommendation for any particular security or investment. I or my affiliates may hold positions or other interests in securities mentioned in the Blog, please see my Disclaimer page for my full disclaimer.
