The advent of ETF’s has opened a vast array of opportunities to investors that was previously hard to reach. One category that applies is the commodities markets. Most investors are not built emotionally and/or financially to endure the rigors associated with trading commodity futures. Not that I have any problem with commodity futures in general. Traders who understand the leverage and who manage risk properly can achieve great things. But the fact remains, that they are not “right” for a lot of individuals.
As always, opportunity is where you find it. Ticker FXE (Guggenheim CurrencyShares Euro ETF) tracks the euro and ticker SOYB tracks soybeans. Investors can trade these ETFs just like they trade shares of stock. While these vehicles do not offer the leverage of futures contracts, they do offer exposure. Both the euro and soybeans have gotten crushed lately. Is there an opportunity there? Let’s take a closer look.
Ticker FXE
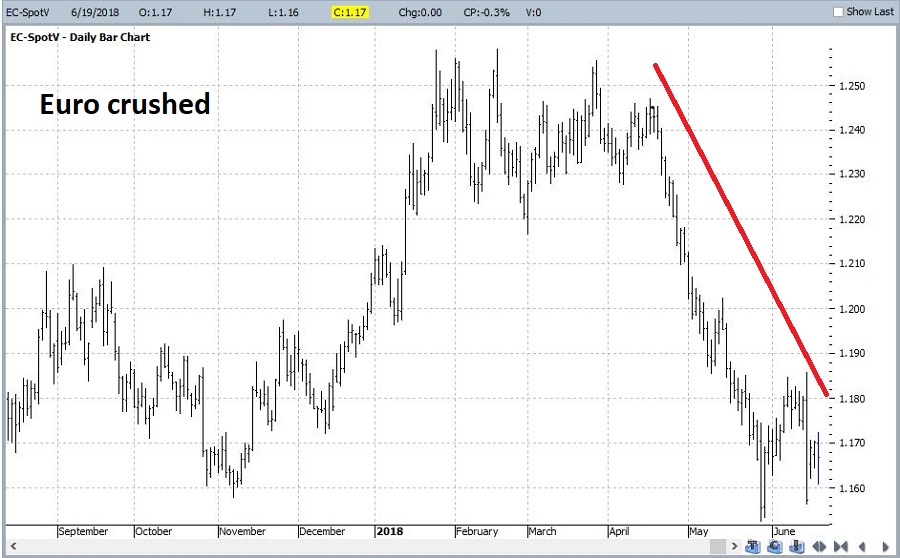
To examine the euro we will look at the spot euro futures contract. In Figure 1 we see the recent decline – a direct result of a strong US dollar.
Figure 1 – Euro sells off hard (Courtesy ProfitSource by HUBB)
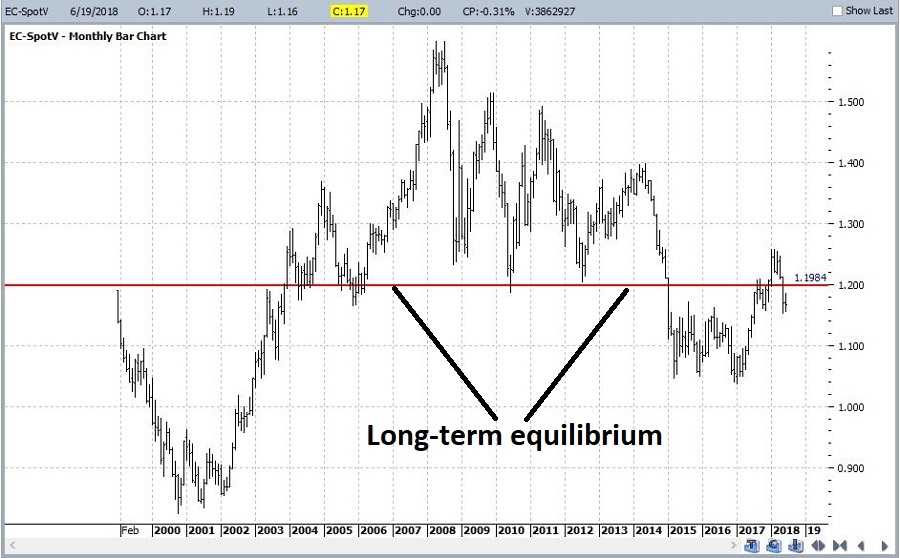
Figure 2 displays a monthly chart of the euro since trading inception. The chart includes a fairly arbitrarily drawn “equilibrium” line to help give a sense of where we are from a very long-term perspective.
Figure 2 – Weekly Euro (Courtesy ProfitSource by HUBB)
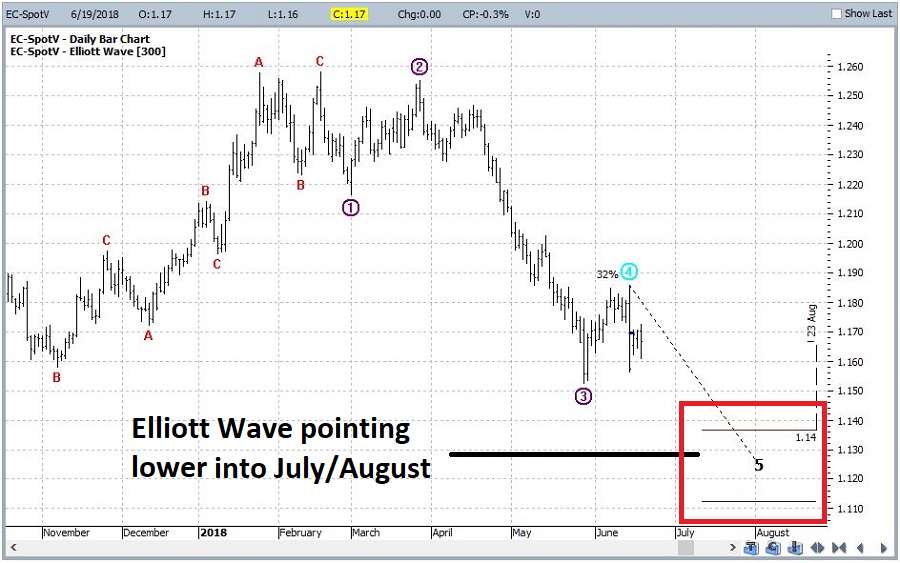
Figure 3 goes back to a daily chart and shows the latest Elliott Wave count generated from ProfitSource by HUBB. It is presently projecting another leg lower into July or August.

Figure 3 – Daily Euro with Elliott Wave (Courtesy ProfitSource by HUBB)
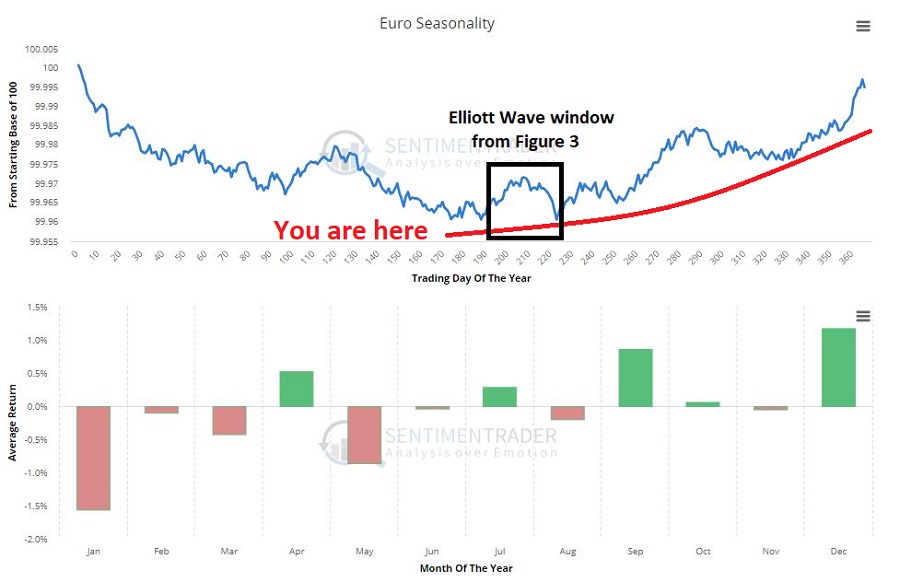
Finally, Figure 4 shows the annual seasonal trend for the euro from one of my favorite websites, www.sentimentrader.com. As you can see in Figure 4, the projected low in Figure 4 coincides pretty closely with the start of a strong second half seasonal upward bias.

Figure 4 – Euro Annual Seasonality (Courtesy www.sentimentrader.com)
So is now a great time to jump in? Perhaps not. But here is my off-the-cuff thinking: If the euro looks really lousy in late July into August it might present an excellent buying opportunity for ticker FXE.
Next: Ticker SOYB (Soybeans)
Disclaimer: The data presented herein were obtained from various third-party sources. While I believe the data to be reliable, no representation is made as to, and no responsibility, warranty or liability is accepted for the accuracy or completeness of such information. The information, opinions and ideas expressed herein are for informational and educational purposes only and do not constitute and should not be construed as investment advice, an advertisement or offering of investment advisory services, or an offer to sell or a solicitation to buy any security.


