Global synchronized growth, as measured by the Global Purchasing Managers’ Index (PMI), remained stable or positive for the past 12 months until Japan reversed the momentum in April with a precipitous drop in its PMI. China is contributing modest growth but, fortunately, the U.S. and Europe are rebounding. This lack of consistent global momentum has created a short-term, volatile, hot and cold, stop-and-go sentiment. Global real GDP growth peaked in 2010 at 5.2 percent then slowed for the next three years to 3 percent. Global growth in 2014 is likely to accelerate for the first time in four years, to 3.5 percent, according to ISI. This is constructive news for commodities.
Brian Hicks and I co-manage the Global Resources Fund using a model that focuses on companies demonstrating robust fundamentals in sectors showing strength. I’ve asked Brian to share his thoughts on the opportunities we see in today’s market.
Q: We’ve seen strength in the major oil companies, service and equipment companies, oil and gas exploration and production (E&P) companies, chemical companies and refiners. What’s behind the strength?
A: The major oil companies have benefited from higher Brent pricing and cheap relative valuation to energy and the broader market. E&P stocks are especially solid because the price of oil is strong. The shale revolution has been a transformative factor for a lot of companies in this space, creating very strong growth in production. Chemical companies and refiners are downstream beneficiaries of the shale play as relatively inexpensive oil and natural gas prices lower their main input cost in the manufacturing of chemicals and refined petroleum products. Because of this competitive advantage in the U.S., we’re seeing chemical companies moving back to the states and creating jobs. Global demand is also increasing for oil and chemicals. 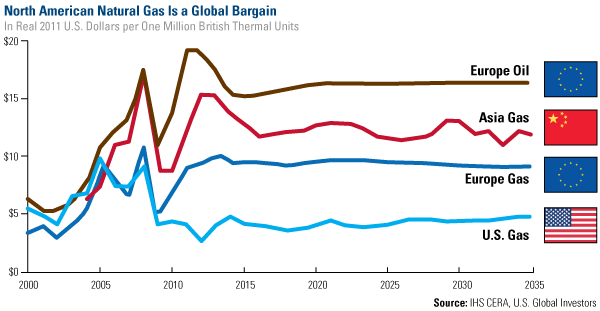
Q: Other commodities such as copper, aluminum and iron ore have been struggling. The Brent oil price hasn’t moved as much as the WTI price. Explain what is happening in these areas.
A: Brent oil isn’t necessarily struggling, but it has been stuck in a sideways trading pattern. Copper prices have fallen hard and subsequently rebounded recently. The metal has experienced a lot of volatility as well. This is mainly due to soft economic growth in China and high inventory levels in global exchanges. Aluminum and iron ore are both oversupplied and the glut has weighed on prices. Until we see cutbacks in production and prices that support profit, they will likely remain weak. Australian iron ore producers have cranked up production to the point where 2014 will likely remain a year of oversupply.
Q: Talk about some of the recent “success story” stocks in the fund.
A: Raging River Exploration (TO:RRX) is a Canadian junior oil and gas producer. The company has a deep inventory of drilling prospects, strong netbacks (the gross profit per barrel of oil produced), and has seen rising profit growth. We bought this name on a price pull back. 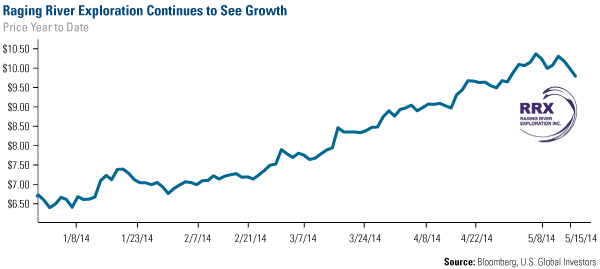
Sherritt International Corp (TO:S) is another Canadian based resource company. It has interests in nickel, coal and cobalt mining. Nickel prices were under tremendous pressure last year due to oversupply but have surged this year since Indonesia banned exports of unprocessed ore in an effort to encourage domestic industrial development. Indonesia is the world’s leading supplier of high-grade nickel ore, which is used to make stainless steel. Sherritt has benefited from this drastic change in the nickel market. 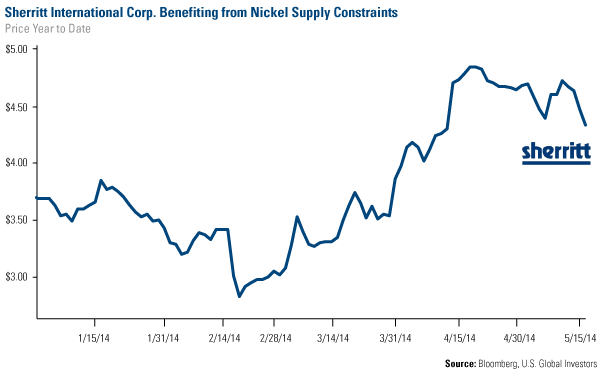
Goodrich Petroleum Corp (NYSE:GDP) is an exploration and production company that looks for natural Gas and crude oil. The company has had positive drill results recently in a developing new play, the Tuscaloosa Marine Shale in Louisiana and Mississippi. We first bought the stock around $14. Today it is trading around $24. 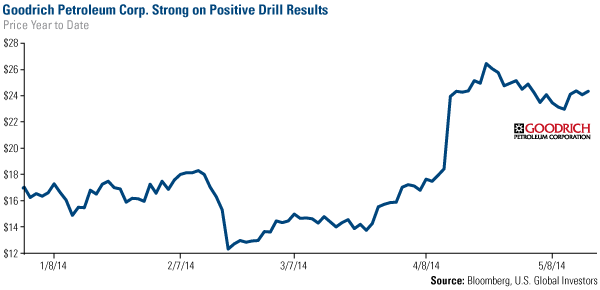
Q: Recently the overall market sentiment has shifted to prefer large cap companies over small cap stocks. Why do you still believe in small caps for the long term?
A: Small caps are where the growth is going to come from, and this is true of resource companies as well. These types of stocks may be out of favor for the time being, but in the stock market everything is cyclical. Eventually, the market will recognize (again) that smaller companies have higher growth potential and the sentiment will shift back.
Going back to 1926, small cap stocks have historically performed better from November through April. Check out the difference between a buy and hold strategy and one where small cap were held during the May-to-October period. 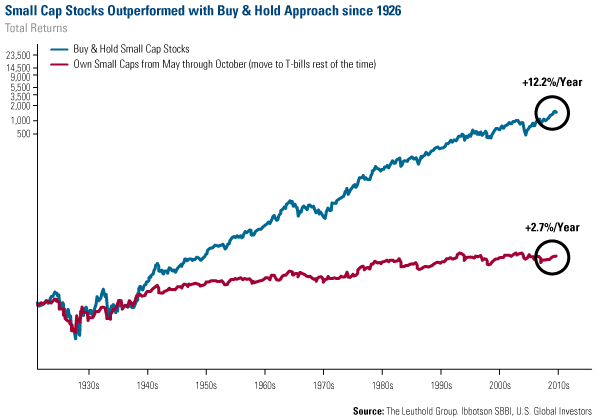
Vancouver is a lovely summer destination and the perfect place to learn more about resource investing. I’ll be speaking there at the Natural Resource Symposium July 22-25. I hope to see you there.
Please consider carefully a fund’s investment objectives, risks, charges and expenses. For this and other important information, obtain a fund prospectus by visiting www.usfunds.com or by calling 1-800-US-FUNDS (1-800-873-8637). Read it carefully before investing. Distributed by U.S. Global Brokerage, Inc.
Foreign and emerging market investing involves special risks such as currency fluctuation and less public disclosure, as well as economic and political risk. Because the Global Resources Fund concentrates its investments in specific industries, the fund may be subject to greater risks and fluctuations than a portfolio representing a broader range of industries.
Fund portfolios are actively managed, and holdings may change daily. Holdings are reported as of the most recent quarter-end. Holdings in the Global Resources Fund as a percentage of net assets as of 03/31/14: Goodrich Petroleum Corp 1.13%, Raging River Exploration Inc. 1.21%, Sherritt InternationalCorp 1.24%.
All opinions expressed and data provided are subject to change without notice. Some of these opinions may not be appropriate to every investor. By clicking the links above, you may be directed to third-party websites. U.S. Global Investors does not endorse all information supplied by these websites and is not responsible for their content.
The J.P. Morgan Global Purchasing Manager’s Index is an indicator of the economic health of the global manufacturing sector. The PMI index is based on five major indicators: new orders, inventory levels, production, supplier deliveries and the employment environment.
