The commodity ETF space had seen some all-stars to start the year thanks mainly to soft stock markets and the excessive under valuation in the natural resource world. Some metals like gold and silver surged on their safe haven investment status, while some soft commodity ETFs (like cocoa) have added double digits on a supply crunch.
However, significant weakness has been seen in the industrial metals space (such as with copper) in the year-to-date frame. All three exchange traded pure plays on copper haven’t seen gains so far this year. Notably, copper exchange traded products lost around 16% last year.
Behind the Slump
The prime reason for this severe slump may be the manufacturing slowdown in the world’s second largest economy, China. The country is the biggest consumer of copper (and other industrial metals) in the world and thus easily regulates the price movement of these industrial metals.
As per Bloomberg, a gauge for activity in China's manufacturing sector fell to a six-month low in January as export orders and output remained sluggish. Prior to this, China's official nonmanufacturing Purchasing Managers' Index dipped to 54.6 in December from 56.0 in November.
The slowdown came in the wake of the government’s effort to tighten up the $6 trillion shadow-banking system and a rise in interbank borrowing costs. Monetary tightening signals decelerating growth in industrial sector, which in turn, cripples the demand for copper.
The data has been lackluster in the other end of the world – the U.S. – as well. Cold weather has frozen the factory output in the U.S. causing the January readings to plunge to the lowest in more than 4-1/2 years. Notably, U.S. is the second largest global copper user at about 10% trailing China (a nation that uses about 40% of global copper).
A demand-supply imbalance is also there to hurt the prices of copper. The Citigroup analyst expects the copper market to see oversupply at least through 2015 and 2016. Thanks to all these issues, iPath DJ-UBS Copper TR Sub Index ETN (JJC), iPath Pure Beta Copper ETN (CUPM) and United States Copper Index Fund (CPER) have lost about 4.25%, 3.87% and 5.20% YTD respectively, underlining the downward trend in the copper market.
Any Hope for Turnaround?
While some analysts remain cautiously optimistic on the journey of the red metal in 2014, some anticipate that the prices of copper will take a middle-of-the-road approach and some are downright bearish on the commodity.
As per the International Business Times, copper will likely rebound in 2014 on the strength in the U.S. construction and utility sector. Apart from that, higher use of copper will also be seen in the production of smartphones and the recovering housing industry in the U.S.
While China is presently grappling with slowing growth, the nation’s utility sector is going to see huge investment. As per Barclays, the State Grid Corporation of China (SGCC), which fulfils about 80% of power requirement in China, aims to enhance its annual investment by 13% to more than $60 billion.
Provided Chinese utilities comprises more than 40% of Chinese total copper consumption, SSGC’s massive lift in capital investment will well explain the potential spike in copper prices in 2014.
The space might see near-term supply crunch, but definitely not long-term, thanks to a recent strike in copper processing facility in Chile which has one of the largest capacities in the world, temporary closure in a Philippines facility ravaged by the super storm Haiyan, planned maintenance in BHP Billiton facility in Australia, a ban on copper concentration export in Indonesia and lower production in China.
However, some analysts expect the red metal to remain range-bound in 2014. Analysts from the likes of BofA Merrill Lynch and INTL FCStone have a neutral view on this industrial metal on growing supplies and moderate demand. Though UBS AG increased its near-term copper price estimate, it believes copper prices this year will remain lower year over year.
Our Take
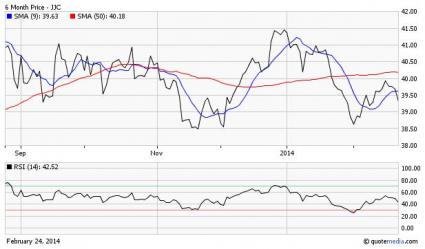
In a nutshell, even if copper recoils in 2014 on some short-term positive blips, the long-term trend is surely sluggish due to unfavorable demand-supply scenario. The relative strength Index for the largest copper ETN, JJC, is presently 42.5 indicating that the product is neither in the oversold nor in the overbought territory. Its short-term moving average is below the long-term average. This suggests bearishness for this ETN.
If the U.S. economy comes up with sound manufacturing and other data in the coming months, which is in fact most likely, the Fed will likely speed up the QE tapering then. This will build worries over continued dollar strength and may mar commodity investing.
In the post-taper world, key emerging markets will also fail to grow at robust rates. Thanks to these factors, we have a Zacks ETF Rank #5 (Strong Sell) for all three exchange traded products that focus on copper, and we are looking for more losses in the space in the months to come as well.
