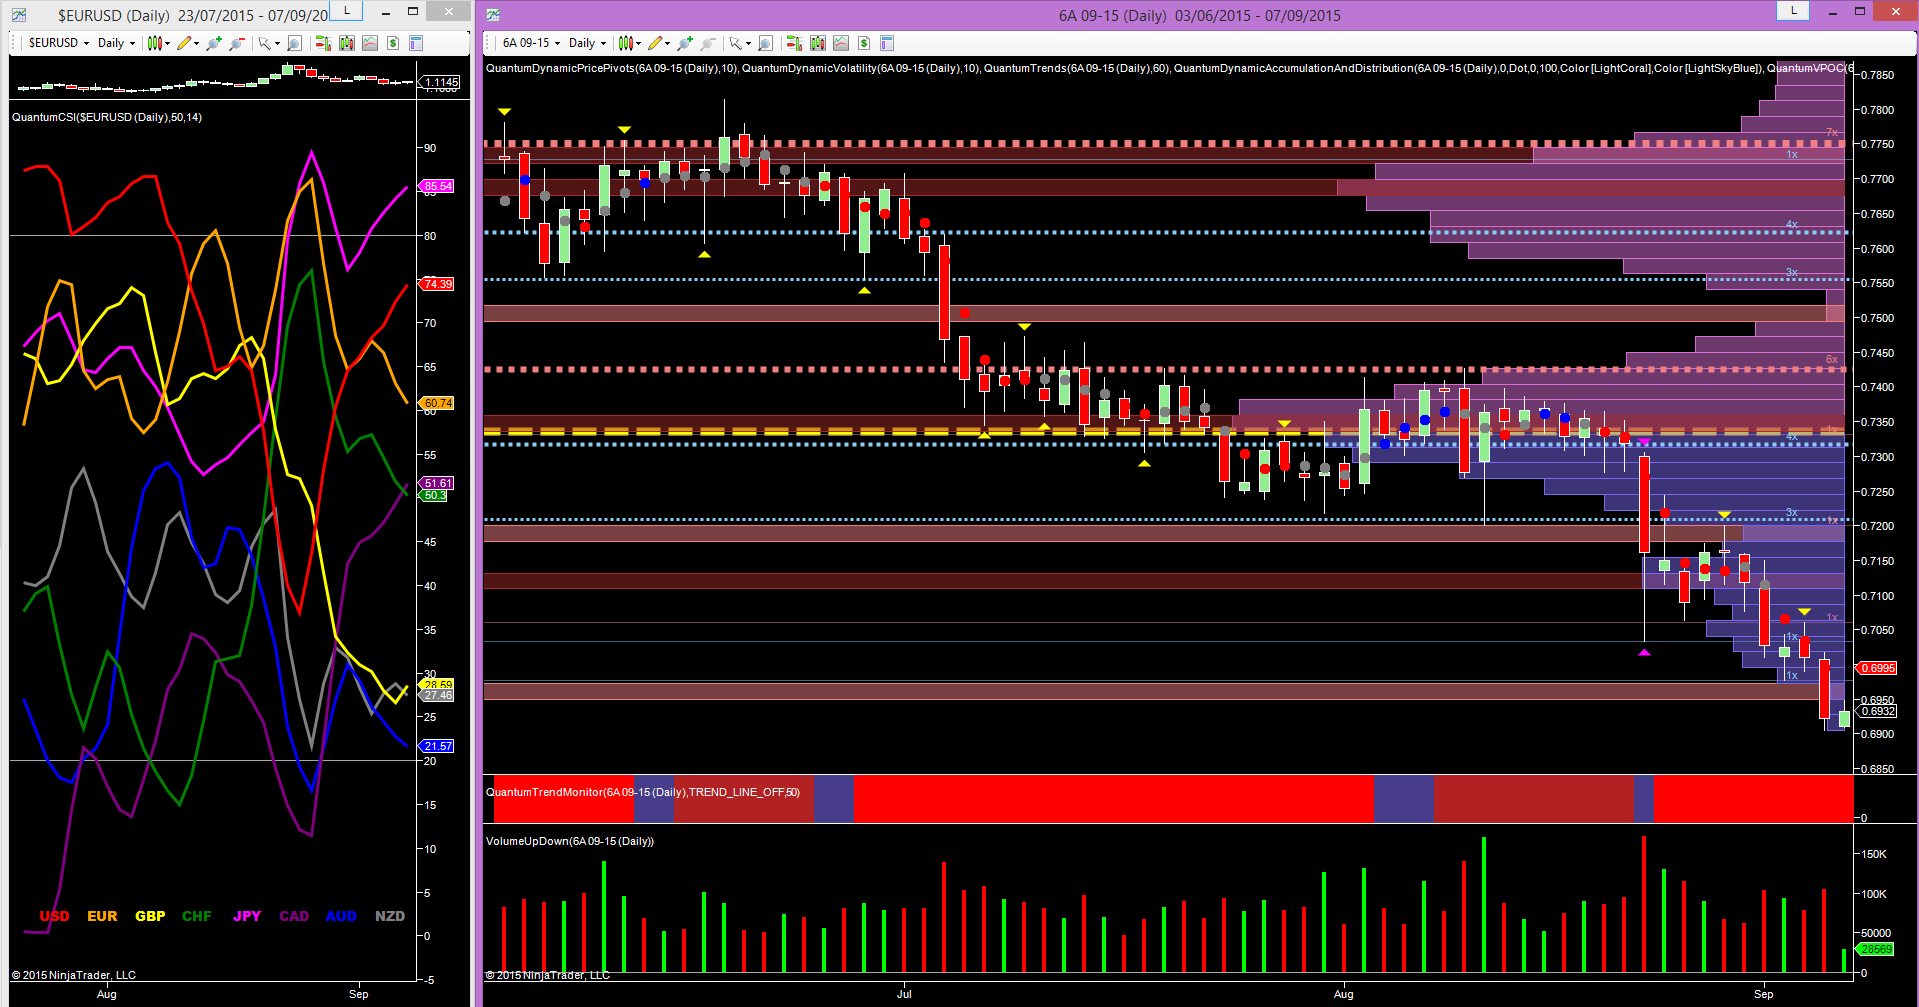
As the new autumn term begins for traders, and with the Labor day holiday offering a gentle return to work after the summer recess, it’s time to revisit our four currency futures—for the AUD/USD, the GBP/USD, the CAD/USD and the EUR/USD—ahead of this month’s key decision for Janet and her fellow members on the board. And for the 6A, the Aussie dollar, it has been a return to business as usual over the last couple of weeks, with the breakaway from the VPOC at 0.7320 once again confirming the heavily bearish sentiment for the pair.
The initial break was signalled on the 24th August with the wide spread down candle which also triggered the volatility indicator, resulting in an expected move back within the spread of the price action; a move designed to trigger stops and frighten traders into weak positions, in equal measure. Since then the candle has duly been confirmed over the last few days with a rapid move through the low volume node on the VPOC indicator at 0.6980 with the pair now trading lower once again at 0.6934 in the London session.
With the weight of transacted volume now sitting overhead in the 0.7320 region and around the volume point of control, this is adding additional pressure to the move lower, which is now gaining momentum once again following Friday’s price action on high volume and confirmed with Thursday’s pivot high. The currency strength indicator to the left of the chart is also confirming this bearish picture for the pair, with the AUD moving firmly lower back towards the oversold region on the indicator, with the US dollar rising strongly and back towards the overbought region.

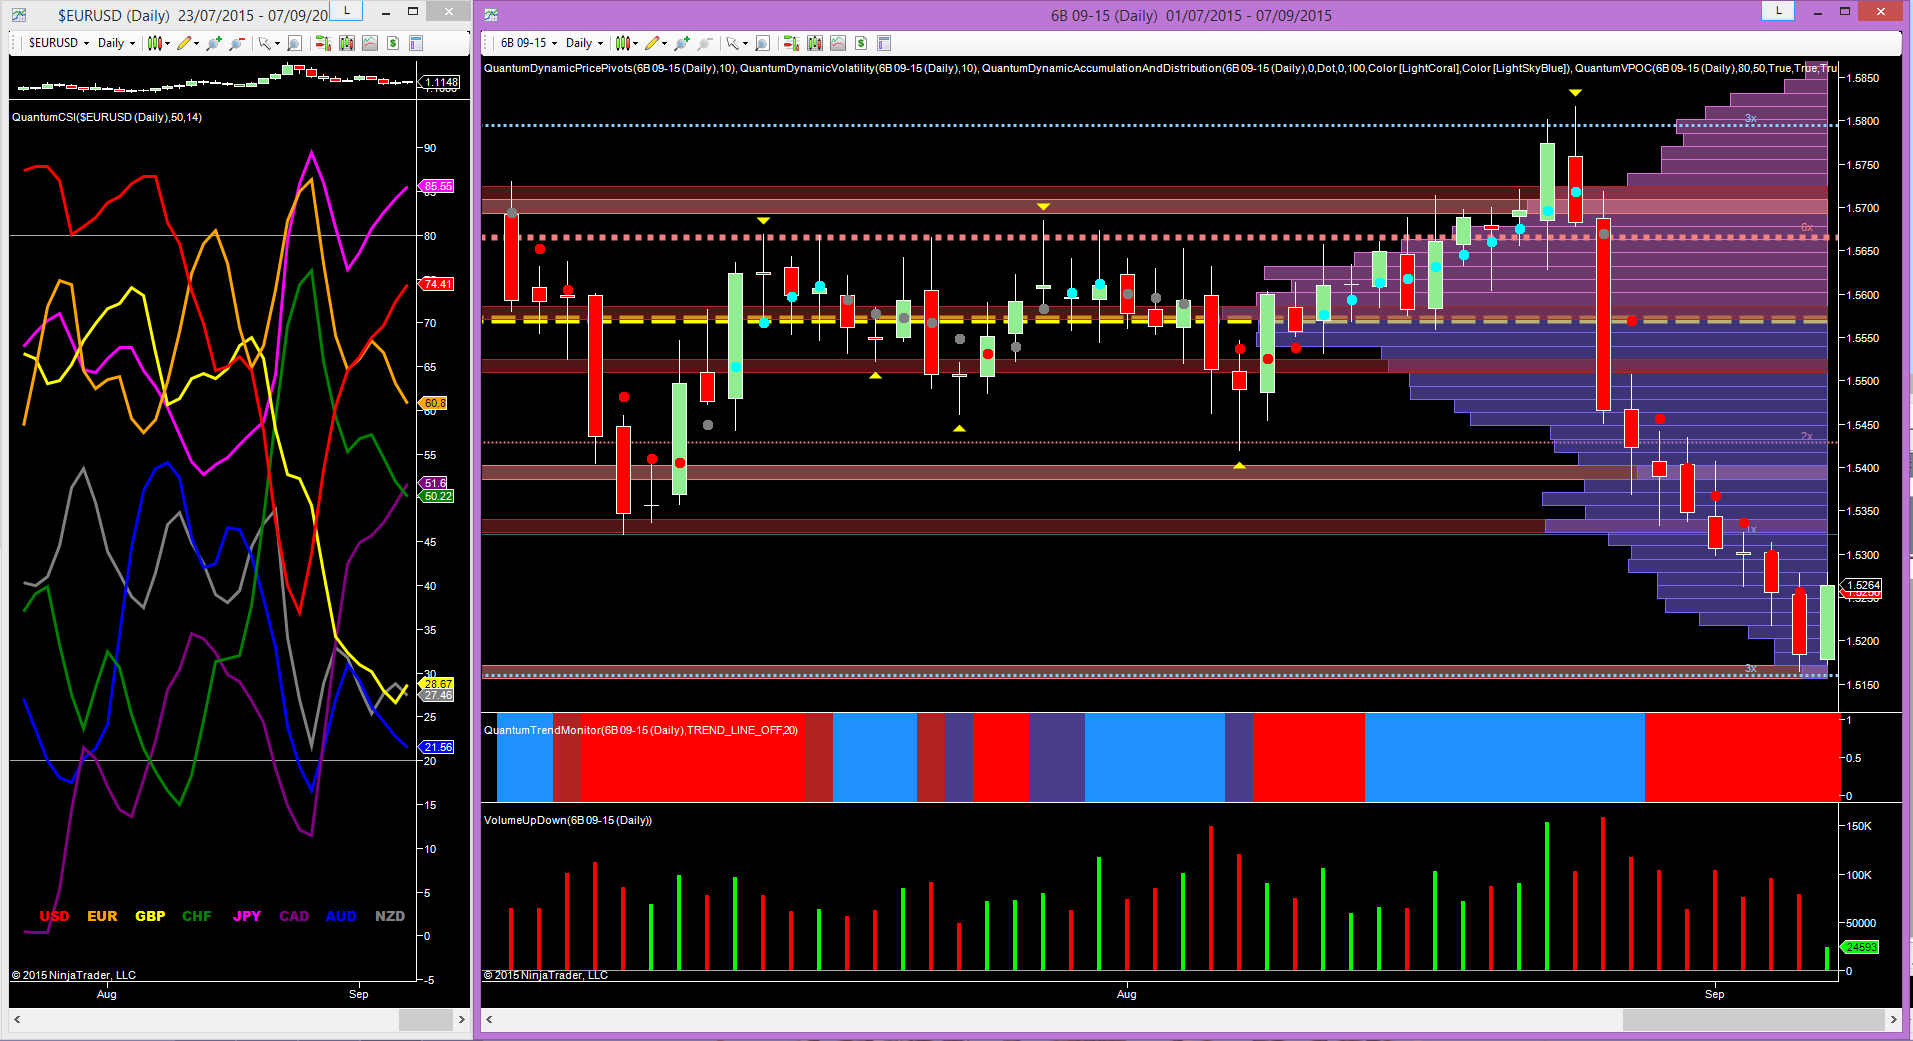
Moving to the British pound and the 6B currency futures contract, the decline for the pair has been both rapid and dramatic and following nine straight days of losses for the pair, it has been no surprise to see Cable recover in trading this morning, as profit takers move in with the US markets closed for Labor day. The move lower has also be characterised by falling volume and suggesting this move is now running out of steam for the time being. And with a platform of now in place at 1.5160, the pair has found some much needed support at this level. Longer term the outlook remains bearish for Cable, and should this platform be breached we may see a move through the 1.5000 region in due course and back to test the 1.4600 region longer term.
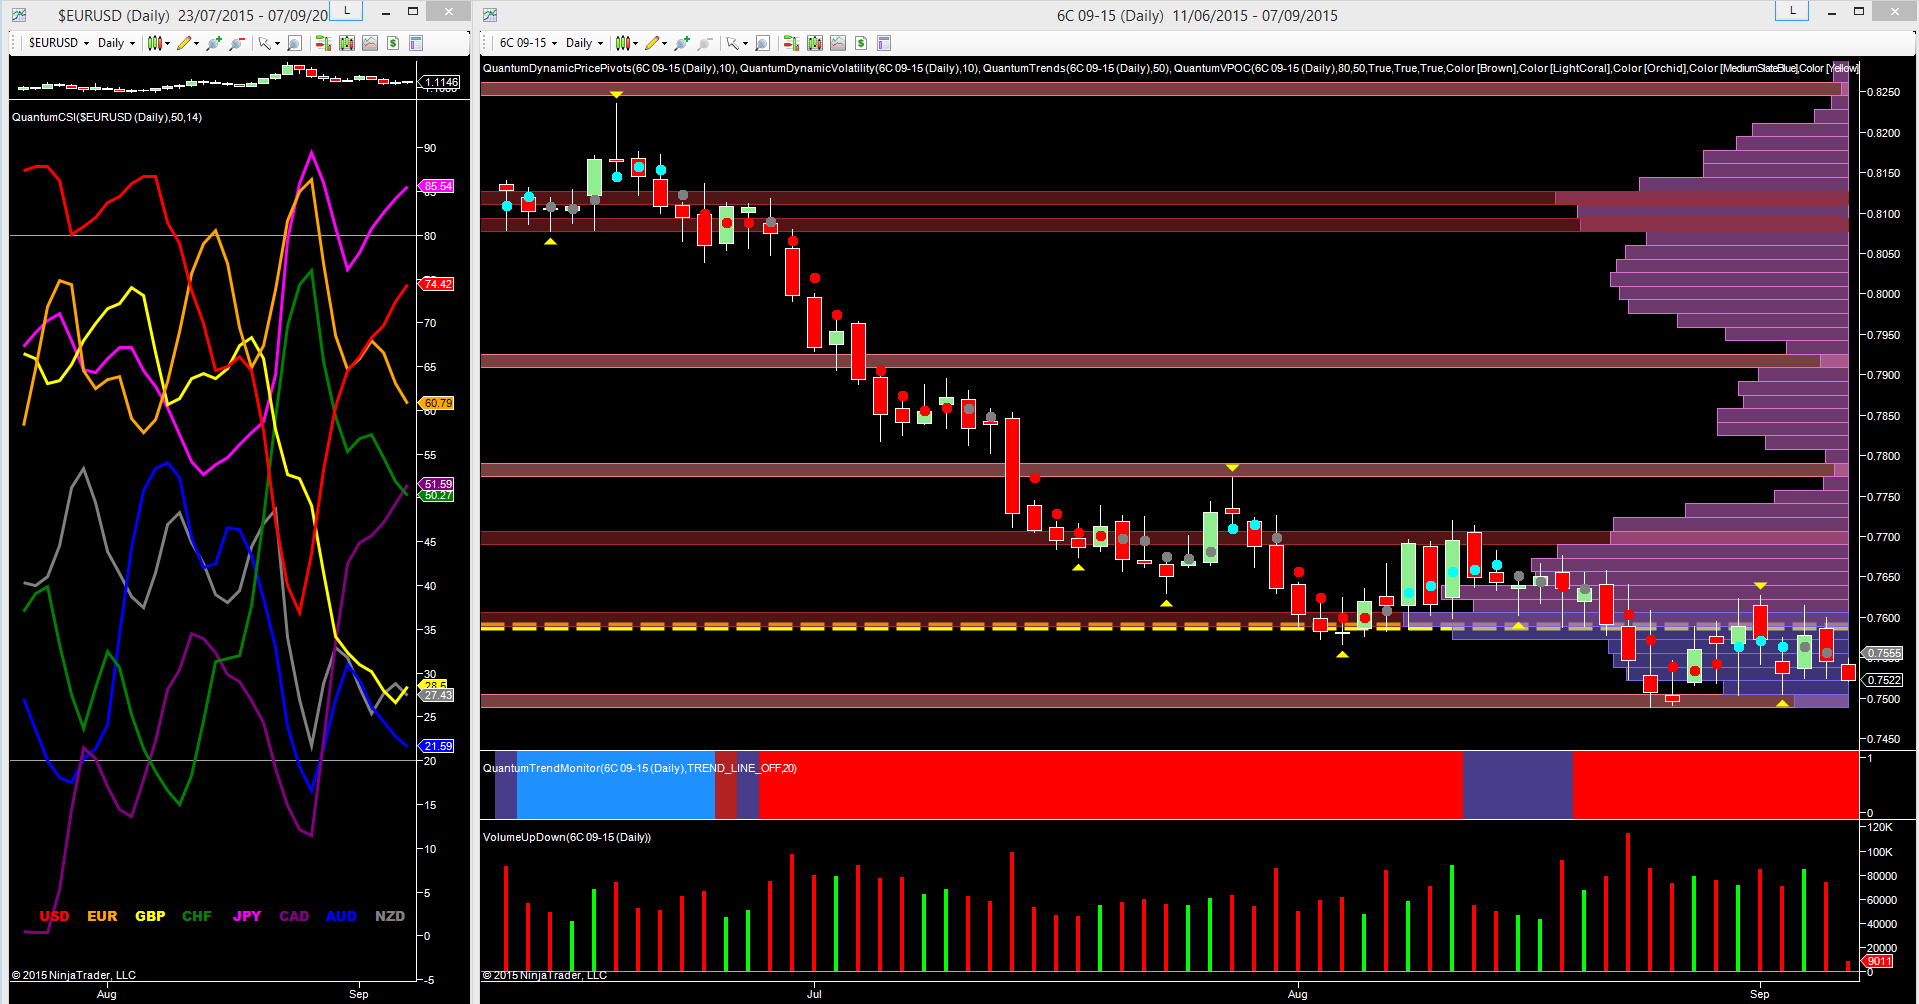
For the 6C contract and the Canadian dollar, the longer term bearish picture for the pair has been driven particularly as a result of the decline in oil prices, and has been the primary driver for the pair. However, with oil prices potentially starting to bottom out in the $35 – $45 per barrel region with a buying climax now on the horizon, this may be the catalyst for a reversal in the CAD/USD longer term. For the time being we are trading very close to the volume point of control which is continuing to build price agreement in this region, so we can expect to see further consolidation in this area in the short term.
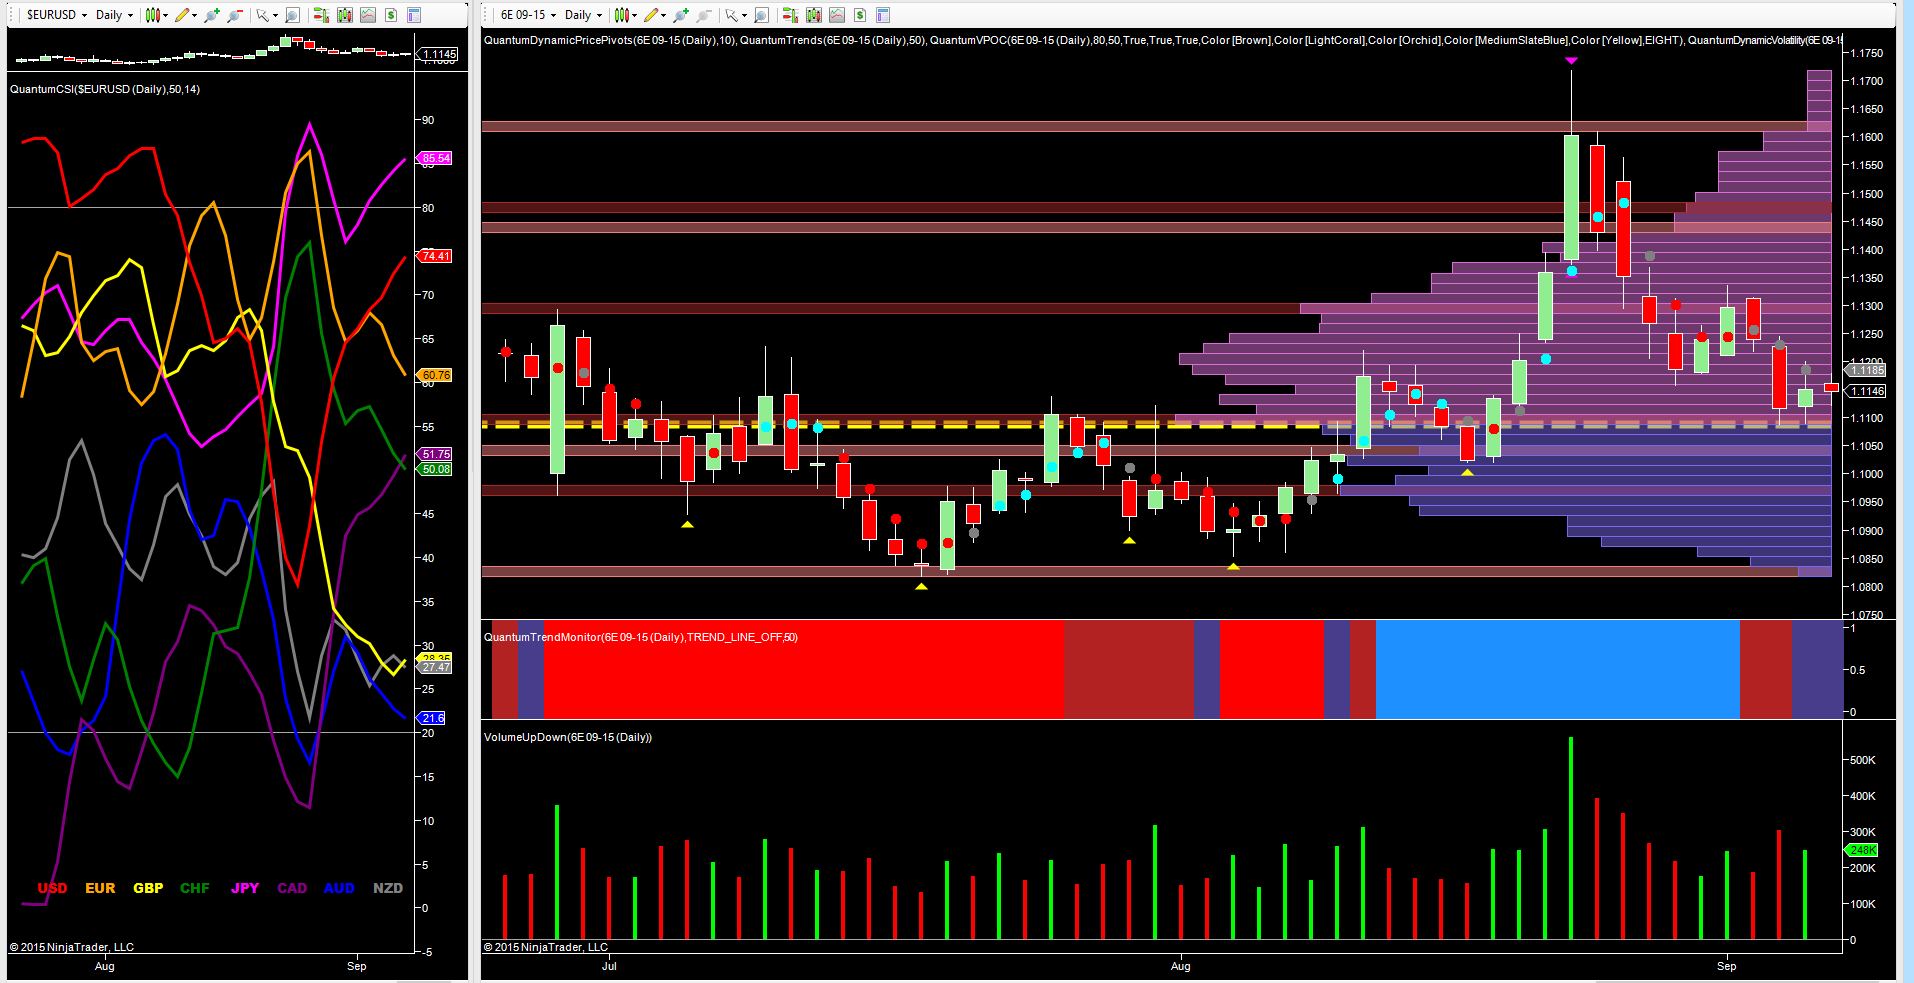
 Finally to the 6E and the euro dollar with the price action of the 24th August once again proving to be seminal and duly triggering the volatility indicator on this timeframe. This was the signal for stop hunting coupled with a trap move from the insiders, with a lack of follow through as the price action duly moved back inside the spread of the candle, and also reversing lower with speed. This was classic manipulation of the single currency on a grand scale, with the associated volume and deep upper wick to the body of the candle telling its own story.
This strong reversal was as expected from the currency strength indicator, which was also signalling the euro as heavily overbought and likely to reverse. Since then we have seen the euro continue lower, and moving well away from the overbought region on the indicator, with the US dollar climbing rapidly. However, given we are now approaching the volume point of control on the daily chart, we may see a phase of price consolidation at the 1.1100 region, before the pair break away from this area in due course.

