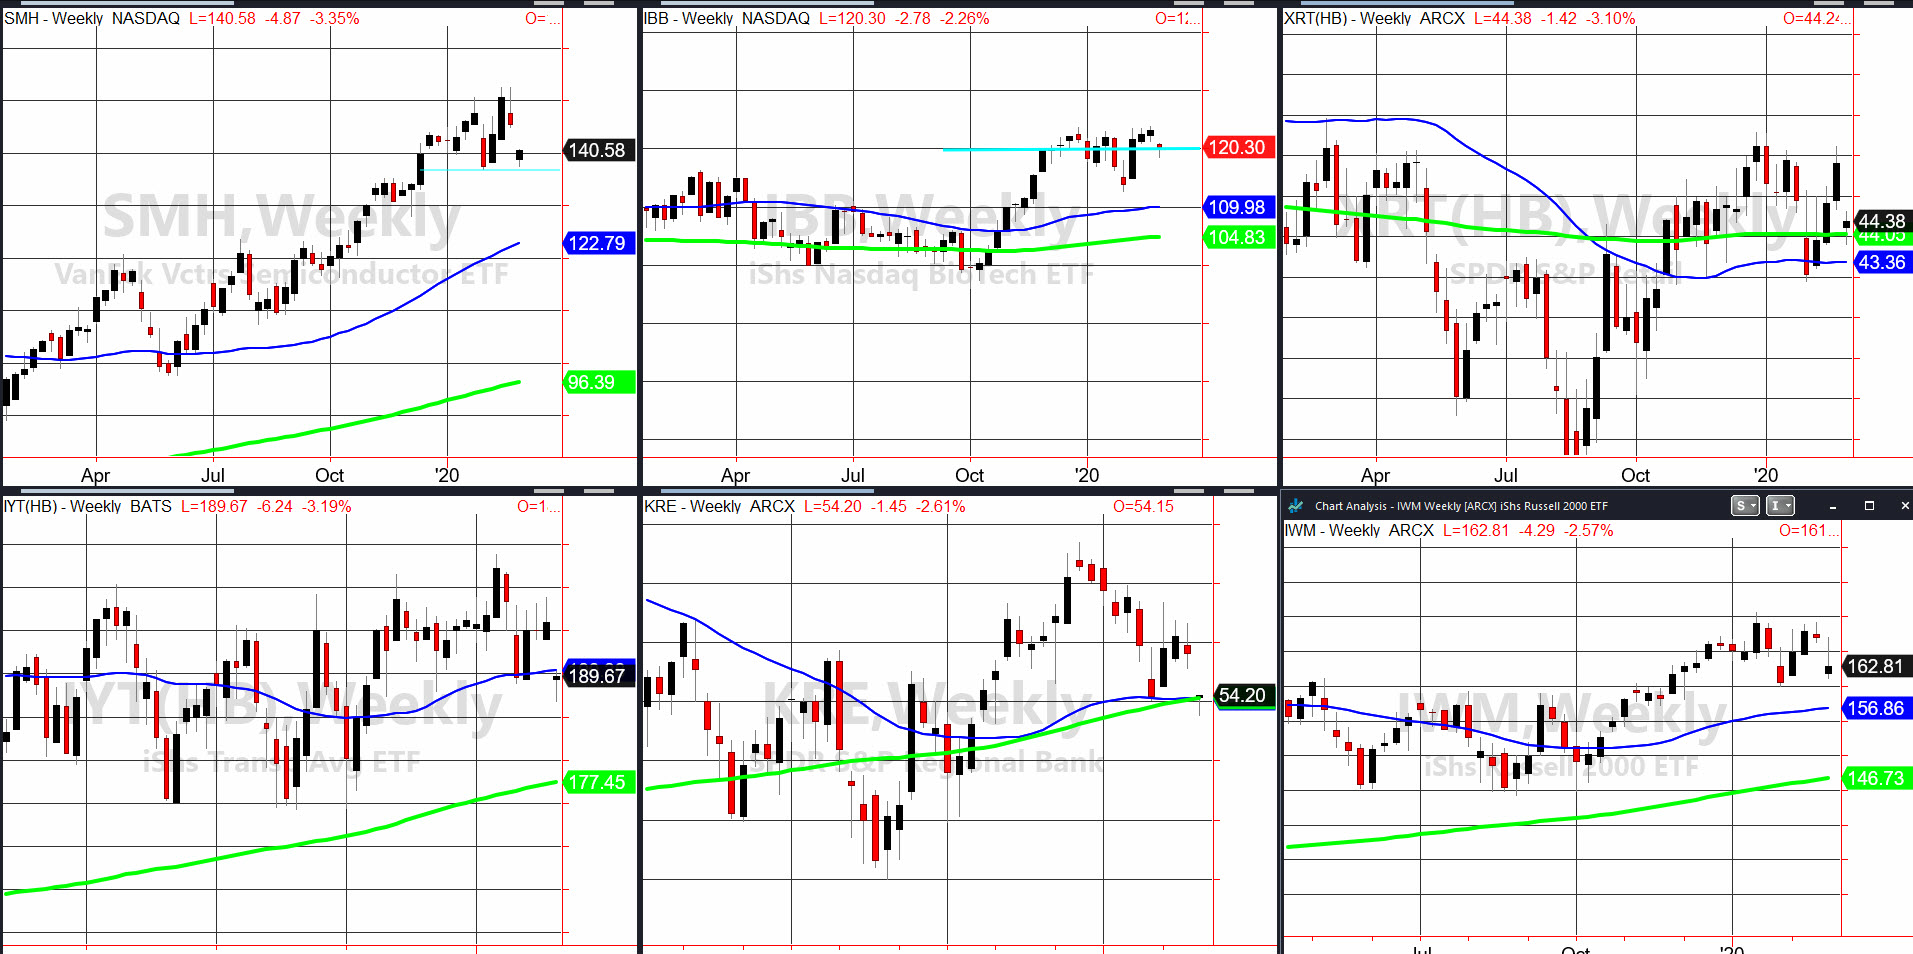
Now that many bulls got bit by the bear early on, the question is whether those bulls can rescind the bear’s invitation.
Thus far in the current market environment, the Bulls, if threatened after inviting a Bear in, simply had to open the shades to let the sun in and the bears disappeared.
The late day rally off the lows in the indices could excite the bulls into thinking they got the upper hand once again.
But do they?

On the updated weekly charts of the Economic Modern Family, I use a couple of trendlines where price support is critical and show the weekly moving averages.
Top left is our superstar Sister Semiconductors SMH. Coming in with an inside week, those lows broke. But, the cyan line is the support it held from 4 weeks ago. And must continue to hold.
Middle top is Biotechnology IBB. The cyan trendline there is the pivotal 120 level that must hold to keep this sector in the game.
Far right top is Granny Retail XRT. Over the weekend I wrote, if she holds over 44.00 that means the garlic she wears around her neck is helping her stay alive. The green line or 200-WMA held thus far.
Bottom left is Transportation IYT. This is just under the 50-WMA (blue) and must clear back over 190.
Bottom middle is Regional Banks KRE. 54.00 is the intersection of both weekly MAs (50 and 200). KRE is holding them and must stay that way.
Far right bottom is Granddad Russell 2000 IWM. 160 or the low from 4 weeks ago is its key support. Plus, 165 is now the major resistance.
I like the weekly charts because they will help us gauge whether the late day bounce is real or whether the market has a lot more downside.
In other words, bears are in the house-they are chomping on the bull’s necks. But, have they sucked out all of their blood or was yesterday just enough of a blood drain to cause a temporary swoon?
S&P 500 (SPY) Unconfirmed warning phase-327 now key resistance with 320 some chart support and important weekly support
Russell 2000 (IWM) 160 support with 165.00 resistance and into a stronger caution phase than SPY.
Dow (DIA) Caution phase and unless it clears 284, a lot more downside on the horizon
Nasdaq (QQQ) The only index that held the 50-DMA. So that means if it gives up 220.47, then that is not a good sign.
KRE (Regional Banks) 54.05 pivotal on a closing basis
SMH (Semiconductors) 136.96 the 4-week low with 140 pivotal
IYT (Transportation) 190 the 200-DMA pivotal and this sector broke down under all MAs on the weekly chart
IBB (Biotechnology) 120 pivotal 117.65 support
XRT (Retail) 44 pivotal and 43.35 the last MA support
Volatility Index (VXX) Confirmed Recuperation phase
