Following on from today’s AUD/USD chart of the day, we take a deeper look at the Aussie dollar across some of the other pairs in a quest to identify where the best trading opportunity lies.
With the last few days of noted USD weakness, the Australian dollar has been one of the biggest beneficiaries as money leaves USD and looks for a home elsewhere.
First of all, to the well published AUD/USD.
AUD/USD Daily:
Click on chart to see a larger view.
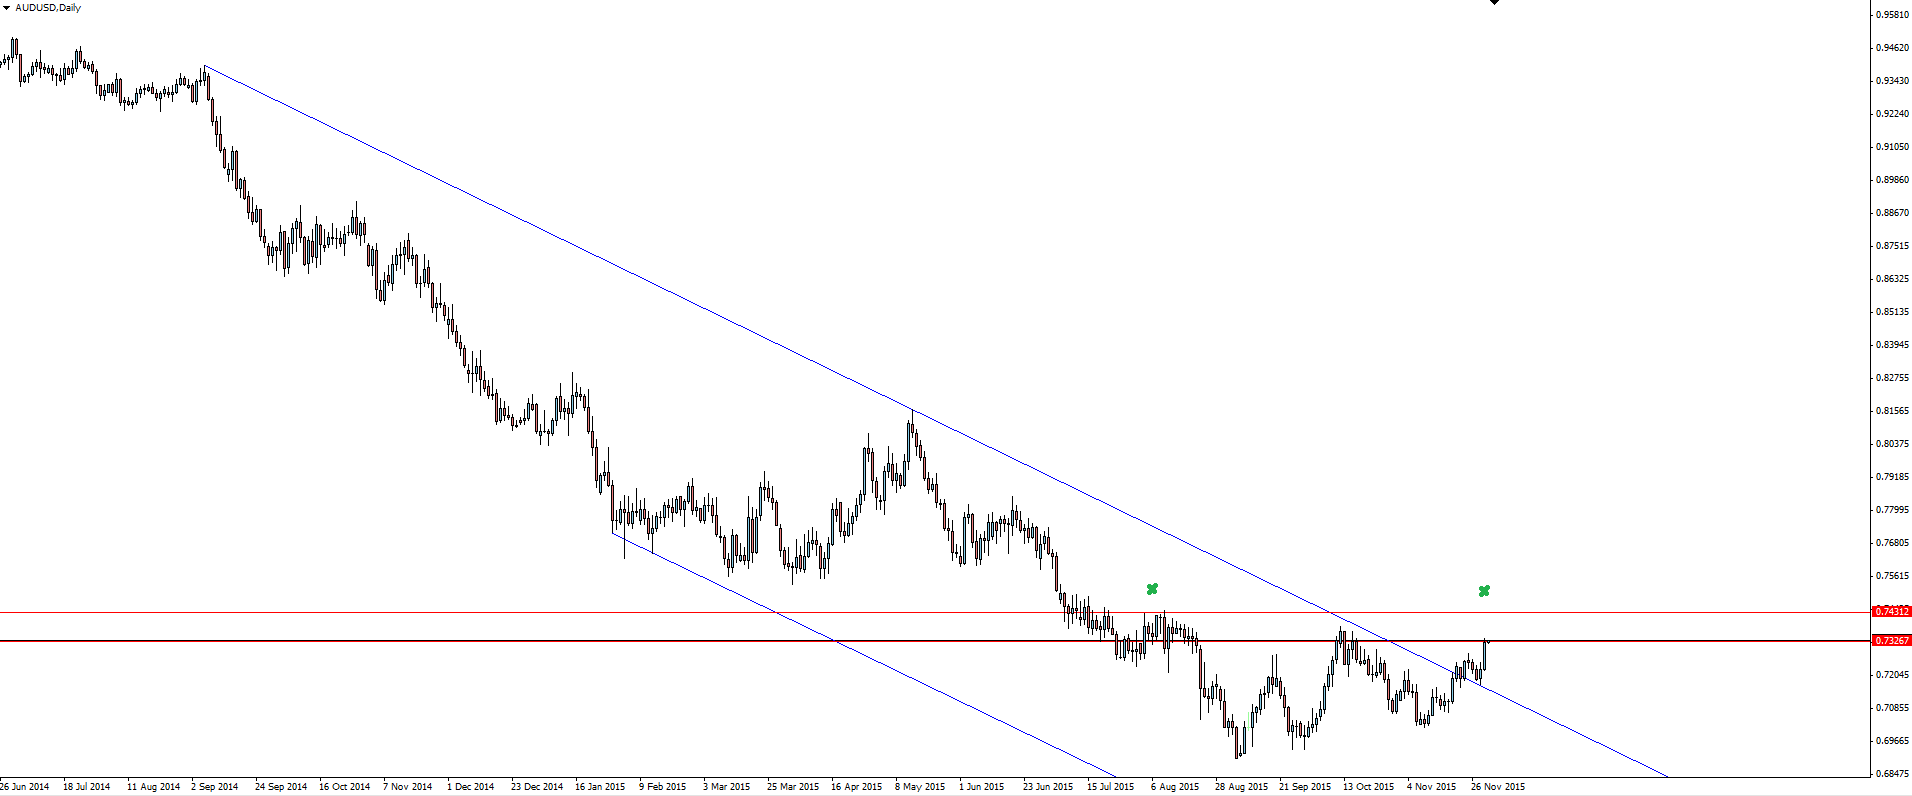
This is a clean version of my Aussie dollar chart, but if you are a reader of the blog then you’ll know about the weekly trend line that has sort of formed a bit of a line in the sand for me to be long above. With price having re-activated the line and kicking on from it well, it’s all about bullish set-ups for me.
Zooming into the daily chart, price has then broken out of its short term bearish trend line and re-tested previous resistance this time as support.
The decision to be made here, is whether you’ve missed the initial move that is now hitting resistance, and whether being 150 pips away from the trend line allows you to manage your risk effectively if you think the move still has some legs left in it.
So what about the other Aussie dollar pairs? AUD/JPY is an interesting alternative.
AUD/JPY Daily:
Click on chart to see a larger view.
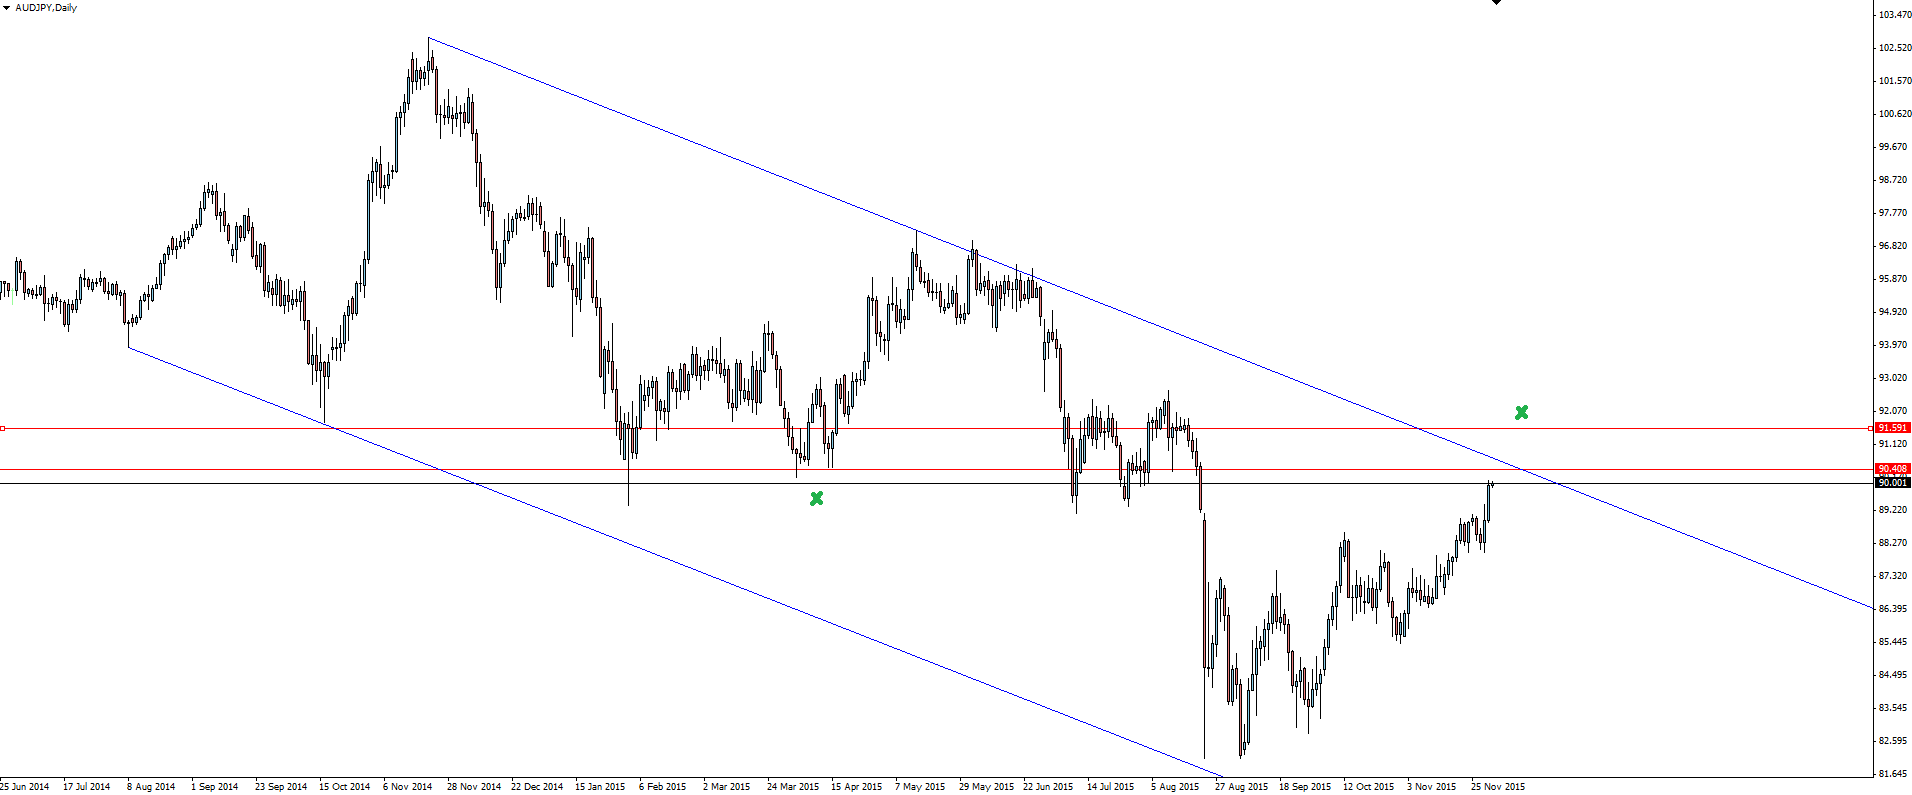
Price on this pair still hasn’t broken from its descending channel yet, which presents a possible opportunity to get long before any breakout move. On the other hand, there is some very clean horizontal resistance lining up with the channel top, which could give any bullish breakouts a headache.
If you’re bullish on the Aussie, playing for a channel break-out early could be a good way to play the strength. The move up toward resistance looks to have some serious momentum behind it and if price does break out, the horizontal support/resistance line there could give price a logical area to re-test before edging higher. Would this still be above any stop loss if you got an initial surge from current price?
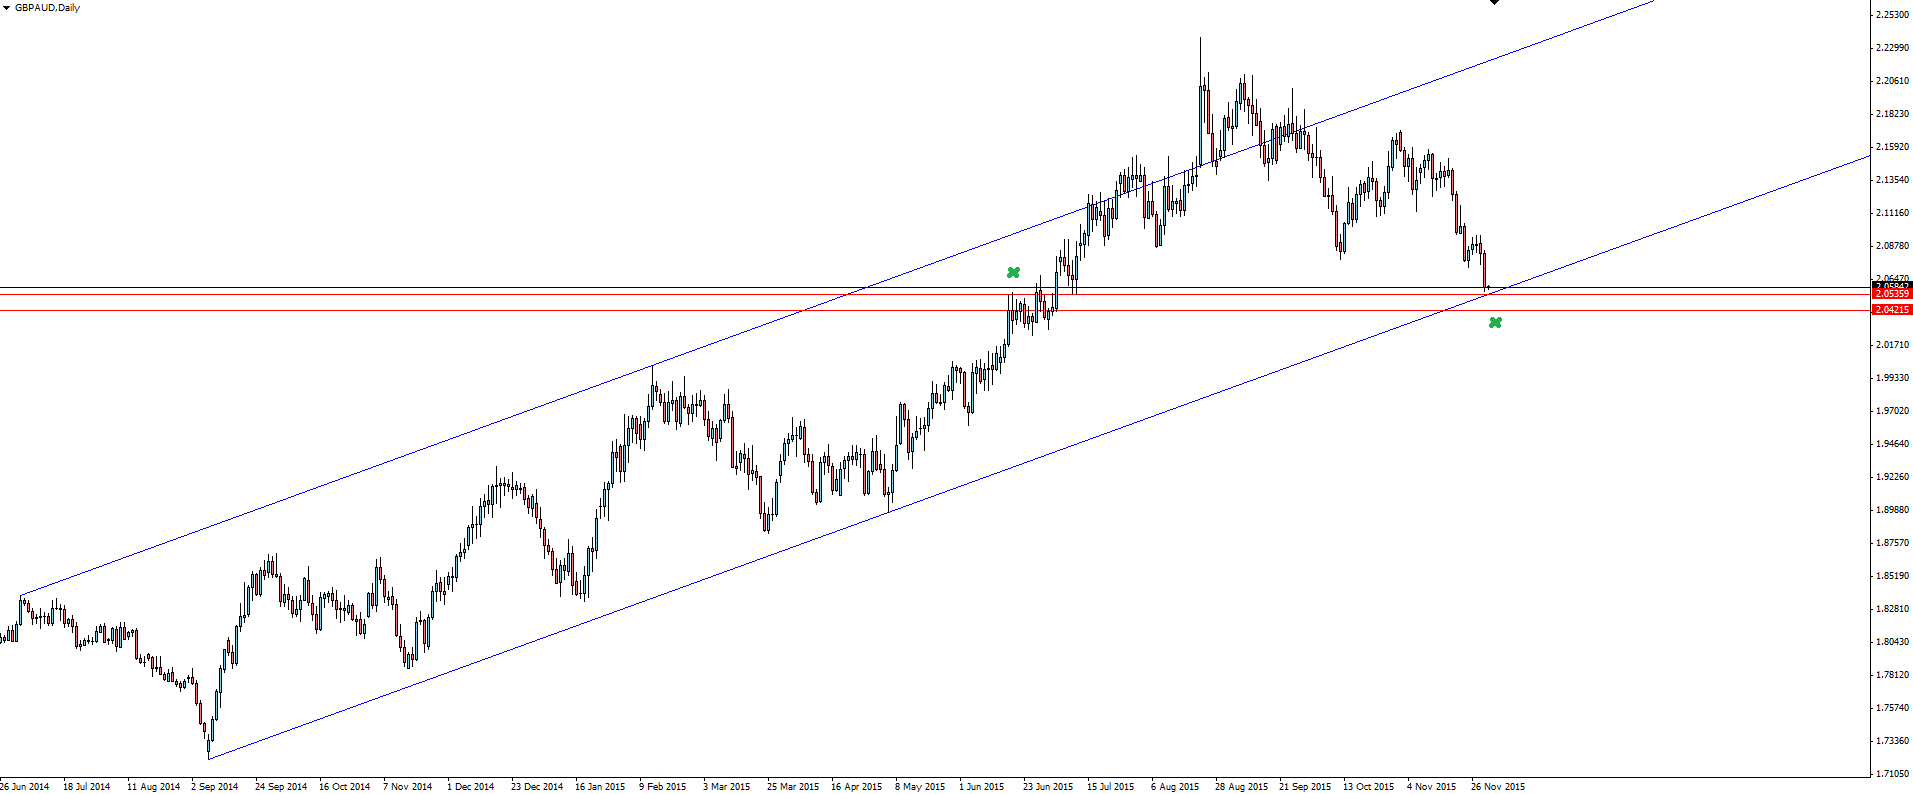
Finally from me, I’ve been watching the previously never ending GBP/AUD strength start to falter as Aussie strength starts to take over from the pound.
GBP/AUD Daily:
Click on chart to see a larger view.
Moves in these GBP crosses can be erratic, and as you can see from the parallel trend line forming the top of the channel, price doesn’t always respect forex cross levels to the pip. Something to take into account when managing the position of your stop loss, especially if you’re using support/resistance lines as your line in the sand.
Wrapping up, it’s worth noting that today’s Australian GDP data also beat expectations but with traders aware of the packed calendar tonight, any bullish reaction has been muted.
“AUD GDP q/q (0.9% v 0.7% expected and 0.2% previously)”
Risk Disclosure: In addition to the website disclaimer below, the material on this page prepared by Vantage FX Pty Ltd, does not contain a record of our trading prices, or an offer of, or solicitation for, a transaction in any financial instrument. The research contained in this report should not be construed as a solicitation to trade. All opinions, forex news, research, forex technical analysis, prices or other information is provided as general market commentary and marketing communication – not as investment advice. Consequently any person acting on it does so entirely at their own risk. The experts writers express their personal opinions and will not assume any responsibility whatsoever for the actions of the reader. We always aim for maximum accuracy and timeliness and Vantage FX shall not be liable for any loss or damage, consequential or otherwise, which may arise from the use or reliance on the service and its content, inaccurate information or typos. No representation is being made that any results discussed within the report will be achieved, and past performance is not indicative of future performance.
