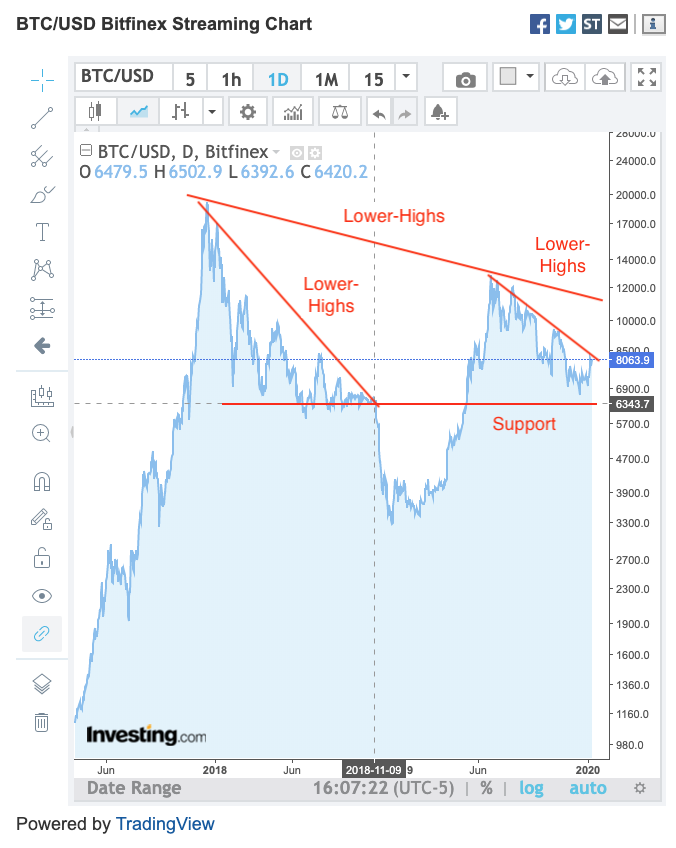
Bitcoin rallied nicely late last week and retook the $8k level. This is the first time since November the cryptocurrency has traded this high. This latest bounce inevitably leads us to the more important question, where are prices headed next?
The most obvious place to start is the attached chart. You don’t need to be a Certified Master Technician to see the problems with Bitcoin’s chart. On multiple timeframes, this currency is experiencing a strong downtrend, most evident by the clearly defined pattern of lower-highs. Last year’s bounce to $10k was impressive and I was cheering for it the entire way, but at this point, it looks like that rebound ran out of energy and every subsequent bounce has been lower and lower. The biggest point of concern is in the mid-$6k range. This is where Bitcoin prices collapsed last time. We still have a bit of a buffer, but things could get real ugly if we return to this critical tipping point.
Bitcoin is setting up for a nice trade here. Hold above $8k and everything is great. But if support fails, look out below. The most obvious way to trade this is buying a move above $8k and shorting a dip under it. While this strategy will inevitably lead to a few whipsaws along the way, no doubt the next big move will start from here and it could go in either direction. I don’t mind getting whipsawed a little over the near-term if it means I will be in prime position to catch the next big move. The best way to manage these nuisance whipsaws is to start small and only add to your position after the trade starts working.
All of that said, given this sickly looking chart, if I were forced to choose, the most likely next move is lower and chances are good prices will undercut last year’s $3k lows. The only hope this has over the near-term is if we break through $12k and end this pattern of lower-highs for good.
