Recessions are a part of the market cycle. There is a usually recession every 7-8 years. Currently we are in the longest bull rally ever. The market showed signs of dying before going back up. I know, the market corrected between 10-12% a couple of times over the last 18 months, but I’m talking about something of a much larger scale—a 50% or greater correction.
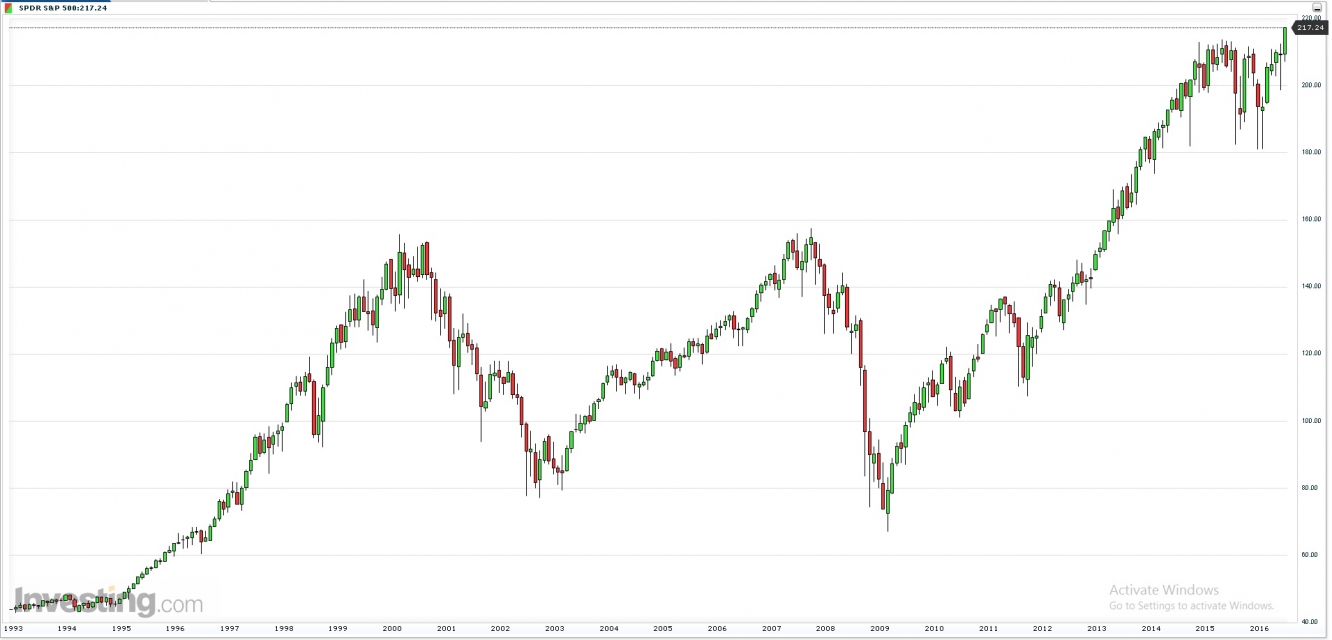
I’m a strong believer in technicals. Let’s look at the monthly chart for the SPDR S&P 500 (NYSE:SPY) for the last 25 years.
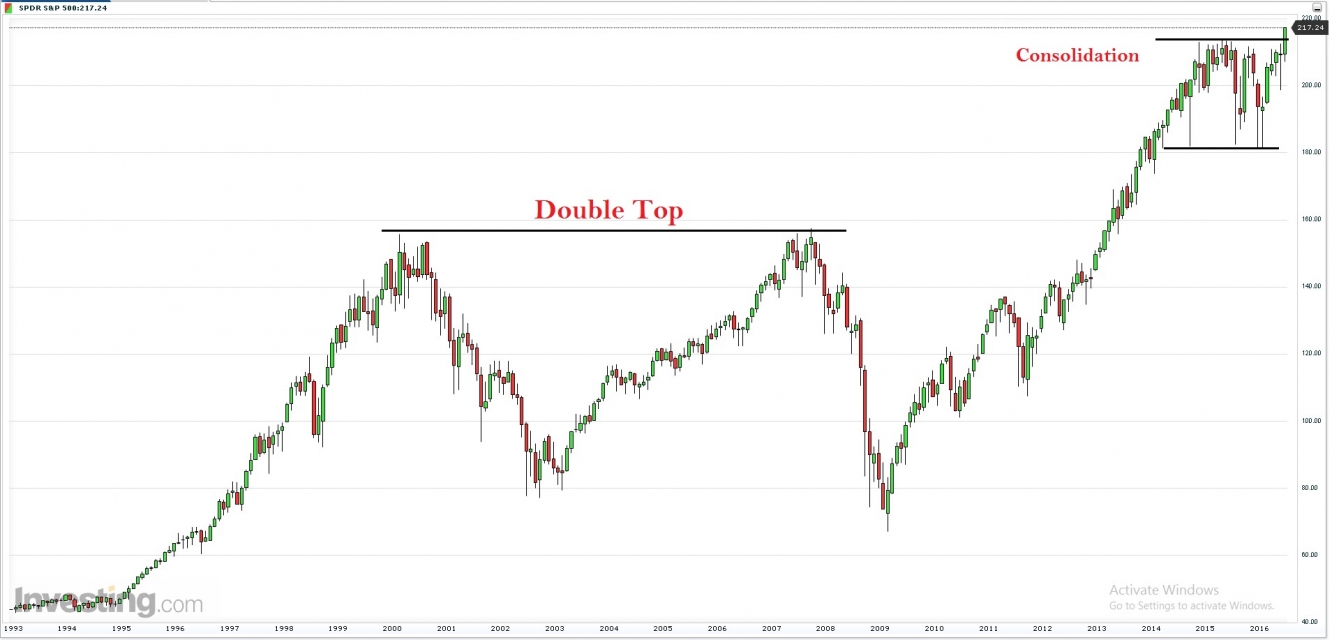
Now let’s draw some levels to this.
As we see in the chart above, SPY trades very technically. The double top from 2000 and 2007 and the grind into the rally are to prove that fact. Now let’s look at some numbers for the two corrections.
(I’m ignoring the dividends on the SPYs for the numbers that follow).
In 2000-2002, the SPY topped at 155.75 and bottomed at 77.06. That’s a 50.52% correction.
In 2007-2007, the SPY topped at 157.52 and bottomed at 67.09. That’s a 57% correction. This meant if you had $100 in 2007, you’d be left with only $43 in 2009. That’s how brutal it was.
Now let’s look at some more interesting things in the chart.
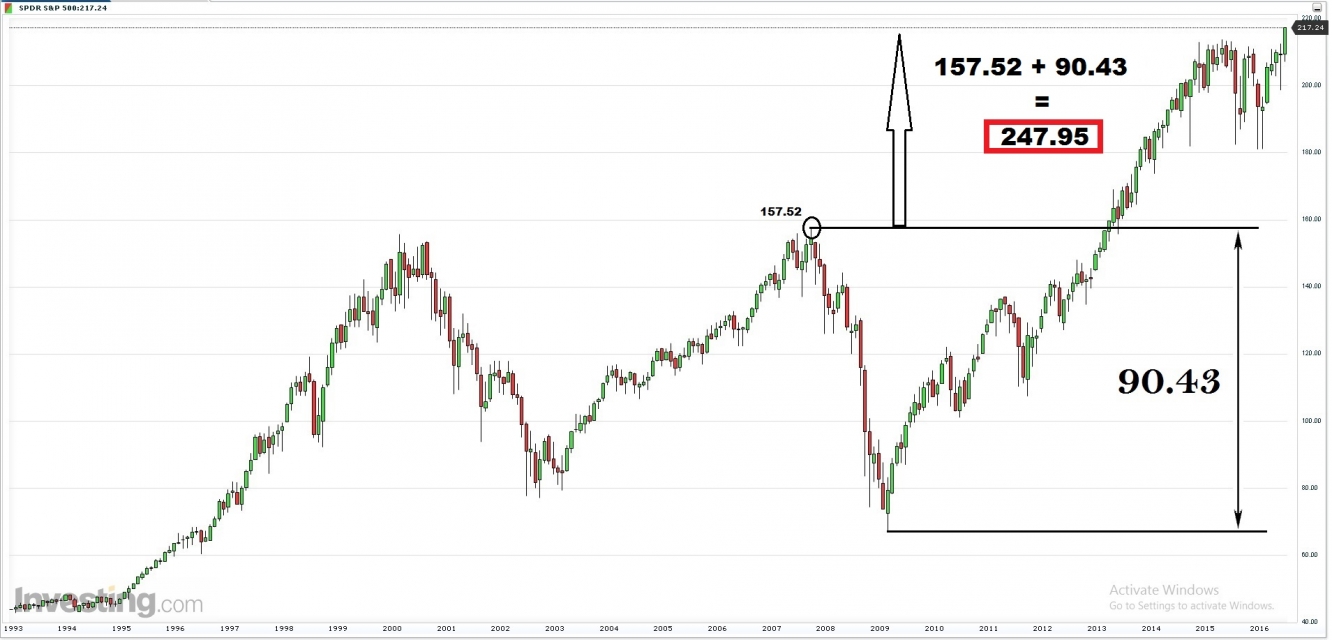
SPY has risen about 150 points from its lows in 2009. If we take a measured move from the highs before the recession and add it we can assume it to be the retracement. Let me show it in a chart to make it clearer.
This would add up the SPY to getting near 247.95.
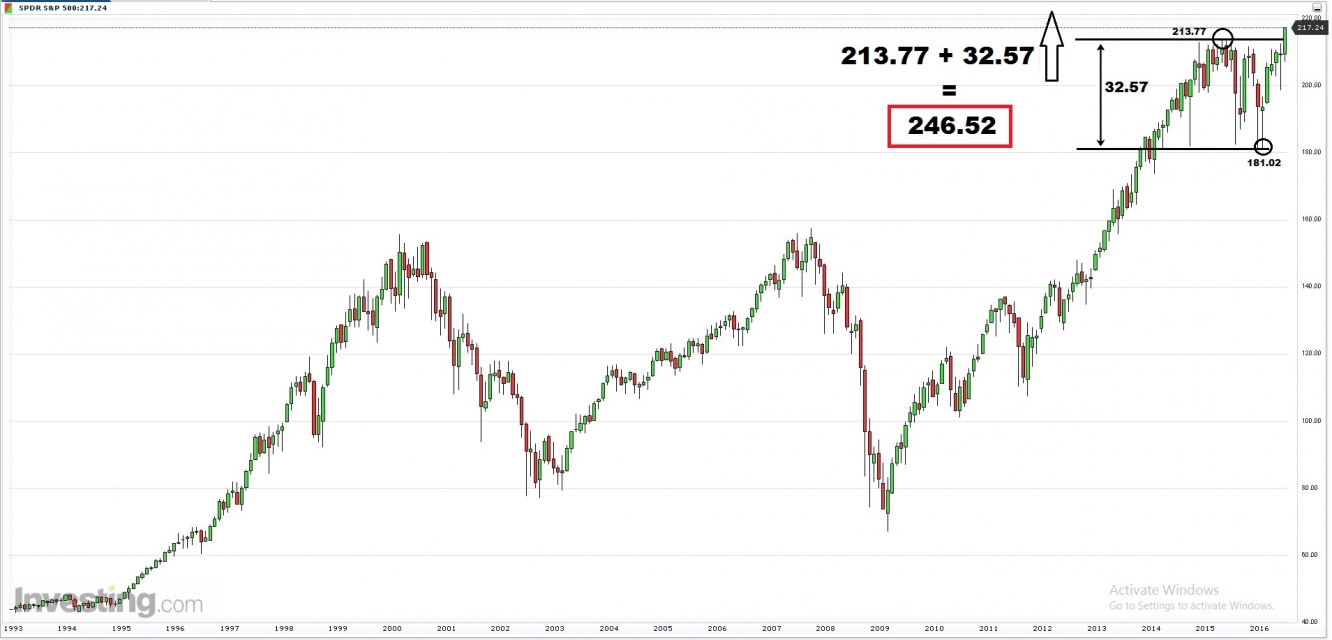
Now let’s look at the recent correction. We had highs at 213.77 and lows at 181.02. That’s 32.75 points in the SPY. Now if we add this range to the top of the consolidation, we get the SPYs at 246.52. That’s less than a point and a half off from the price we got taking the measured move. This makes me believe, taking all factors into account, that we will see the next major correction when the SPY gets to the 245-250 range.
Summary: I expect the next major correction to happen in the 245-250 range and will not be going short before that.


