Traders are a silly bunch sometimes. They often forget the basics like markets go up, markets go sideways, markets go down, markets get quiet, markets get volatile, and so on. And then when they get so used to something doing this or that, they start to think that the status quo will never end. Like now. In a variety of markets.
One way to tell when this is happening is to look at the implied volatility (IV) of the options on a given security. When traders reach that “well, whatever” state of being it is typically accompanied by a decline in IV (The short lesson: all options have some time premium built into their price prior to expiration. High volatility means lots of time premium, low volatility means very little time premium) as traders simply lose interest and start to figure that “nothing will ever happen” with that given security.
And of course, markets being what they are, very often they are wrong.
A Cross Section Of The Blahs
The charts below display the price action for a variety of ETFs as well as the historical and current IV levels for the options on each. The point should be self-evident.
Guggenheim CurrencyShares Euro
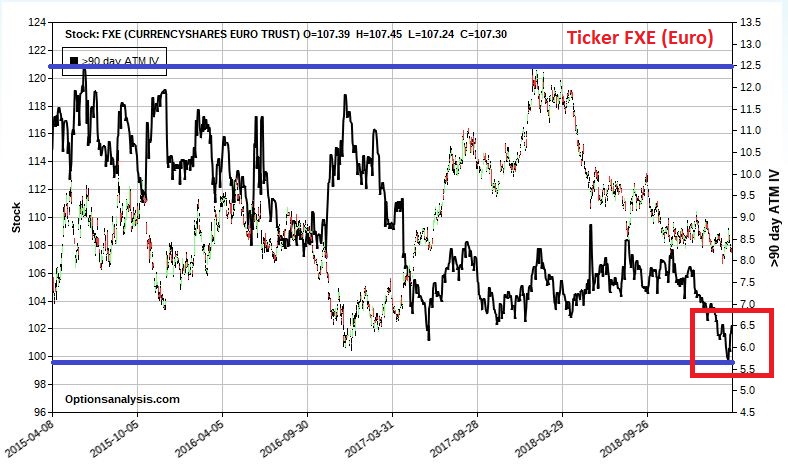
Figure 1: Courtesy OptionsAnalysis.com
iShares 20+ Year Treasury Bond
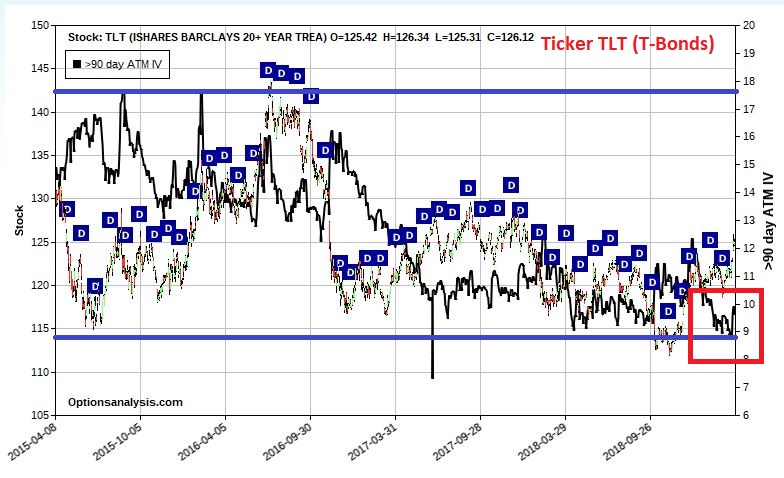
Figure 2: Courtesy OptionsAnalysis.com
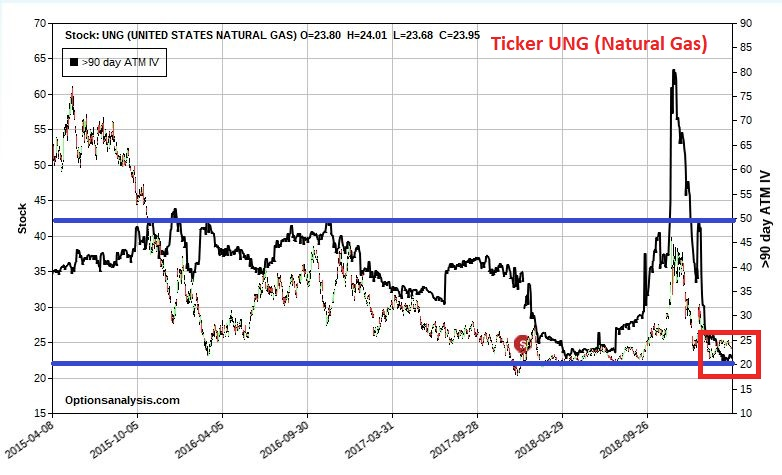
Figure 3: Courtesy OptionsAnalysis.com
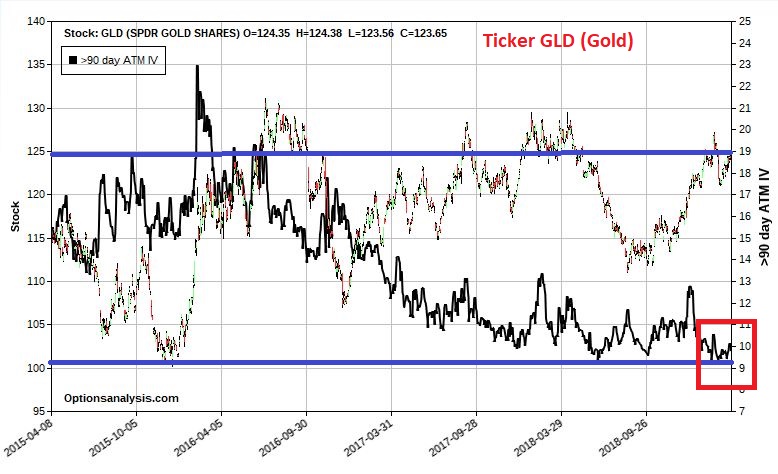
Figure 4: Courtesy OptionsAnalysis.com
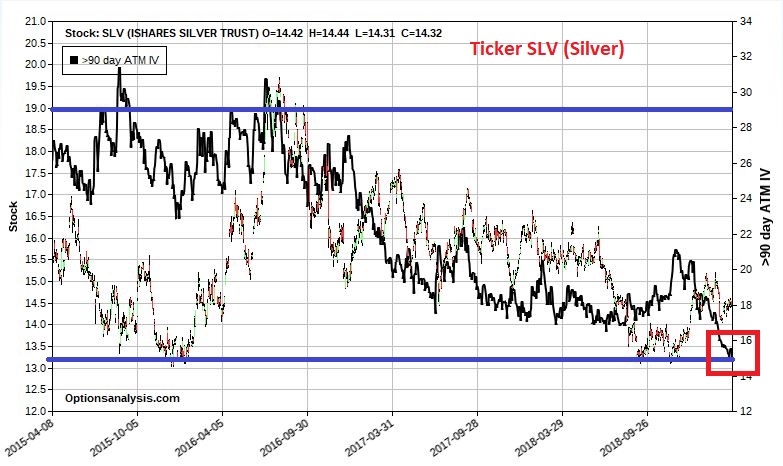
Figure 5: Courtesy OptionsAnalysis.com
What should be obvious is that IV for these securities is extremely low – i.e., traders have determined that there is nothing going on in these tickers and there is no expectation for a pickup in volatility any time soon.
3 Things To Note
- I have no predictions to make for any of these, bullish or bearish
- When traders as a group get this complacent they are typically (though importantly, not always) wrong
- When IV is low, the options are cheap
So, from there we can make the following leap:
- Something surprising may be coming in these markets that will surprise traders
- We don’t know if the surprises will be to the upside or the downside
- We know that the options are cheap
There is an option strategy for that scenario. It's called a “strangle,” which involves buying both a call and a put at the same strike price and waiting for the underlying security to make a meaningful move in one direction or the other. Another alternative is buying the strangle, which involves buying a call and a put with different strike prices.
Some Examples
As always, the trades displayed below are NOT recommendations, only examples.
Take Note:
- In the world according to me, the “correct” range for straddles is options with 60 to 140 days left until expiration.
- Anything less and time decay can work against you heavily and there may not be enough time for the underlying security to make the move required to generate a profit.
- Beyond 140 days, you often are dealing with less liquid options, which can also be less price sensitive
In this case, I'm making an exception and going out a little further. Two reasons for this:
- I have no idea if or when these tickers may actually make a significant move, so I want to give them a lot of time.
- The options are about as cheap as they have ever been, plus longer-term options are more sensitive to changes in volatility. So, if volatility picks up, these options may get more of a time-premium bump.
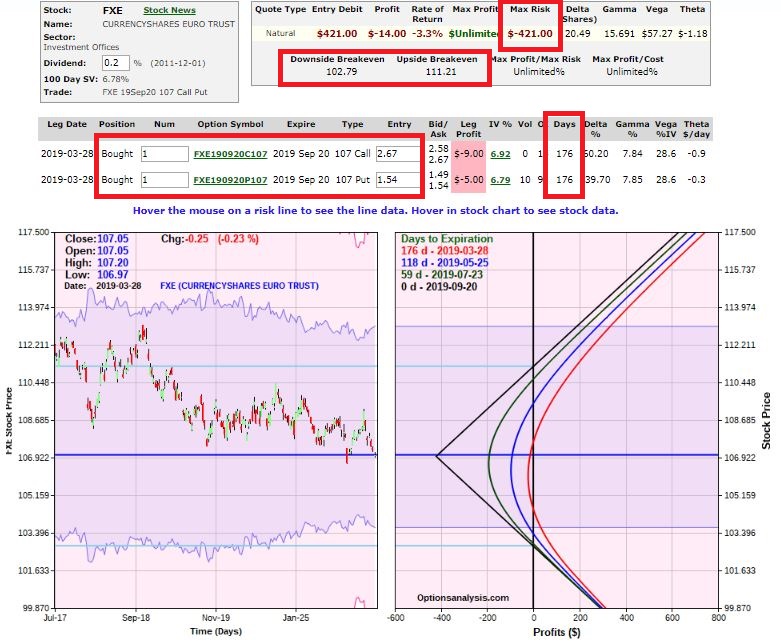
Figure 6: Courtesy OptionsAnalysis.com
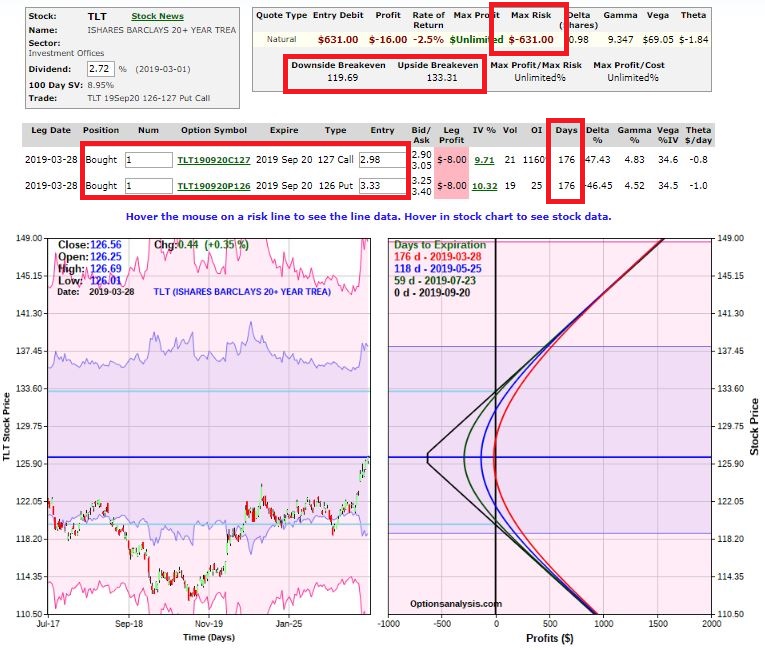
Figure 7: Courtesy OptionsAnalysis.com
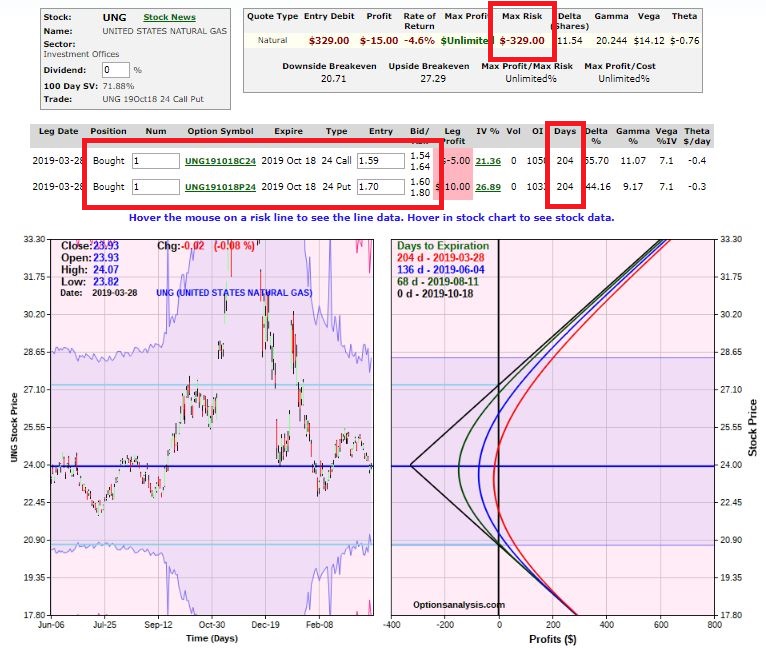
Figure 8: Courtesy OptionsAnalysis.com
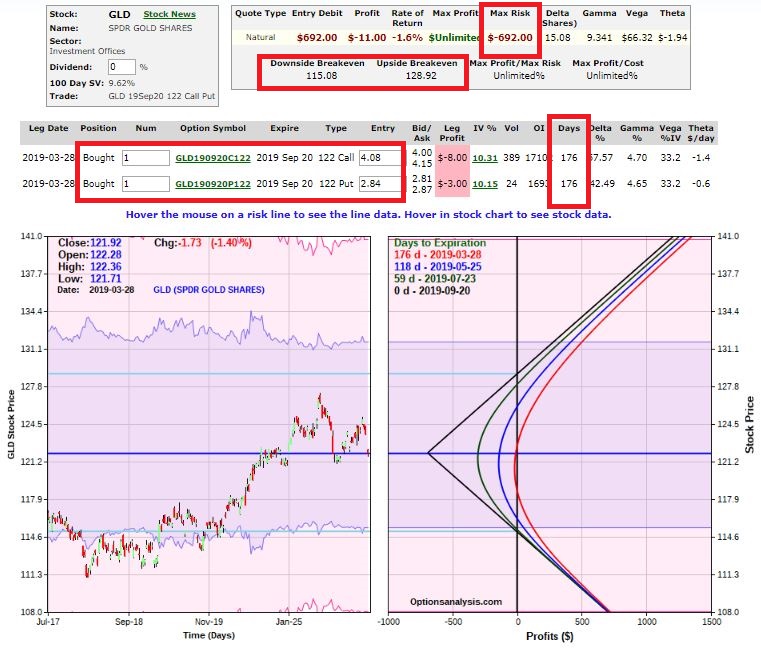
Figure 9: Courtesy OptionsAnalysis.com
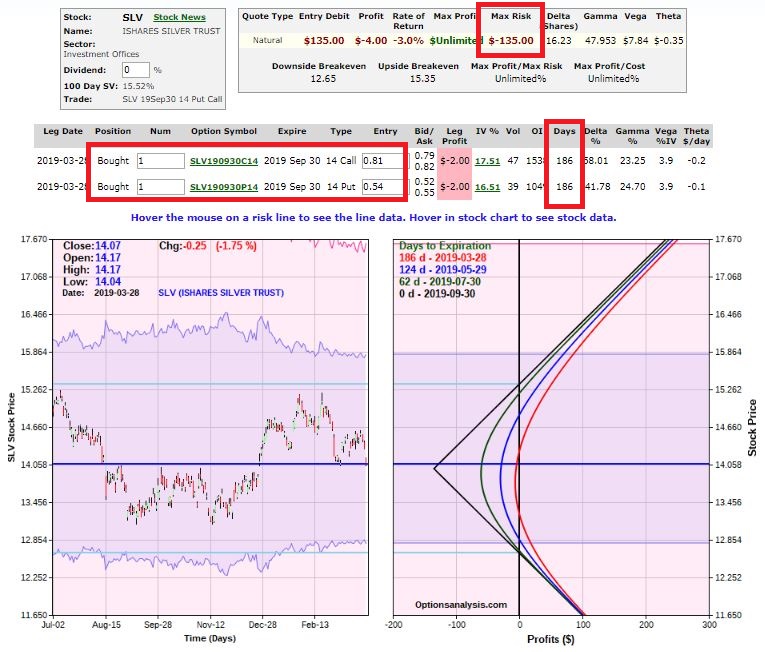
Figure 10: Courtesy OptionsAnalysis.com
Based on the above:
- A significant up-move or down-move in price will generate a profit.
- A continued sideways movement will likely generate a loss.
- A sharp rise in implied volatility will help the trade by inflating the time premium built into the options.
Summary
Will the markets highlighted continue to drift or trade within a range between now and September/October? It’s certainly possible. Will the example trades noted generate a profit? It beats me. But that is not the point of this piece.
The point is simply to highlight:
- That extremely low IV often indicates complacency and may be followed by more volatility than expected.
- Options offer a way to play this situation
