As a trader, the answer to that question is when you are positioned on the right side of the market.
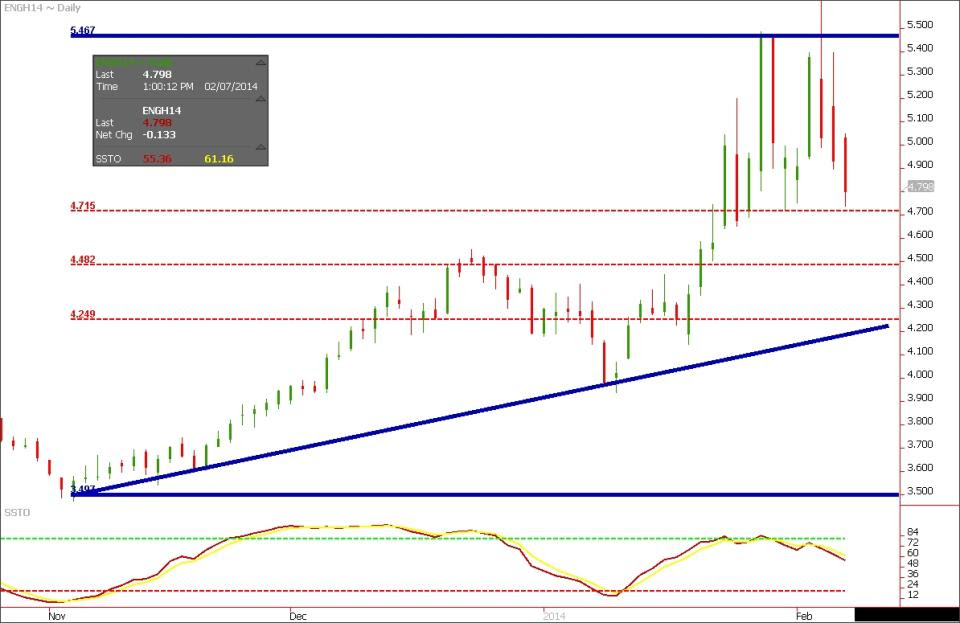
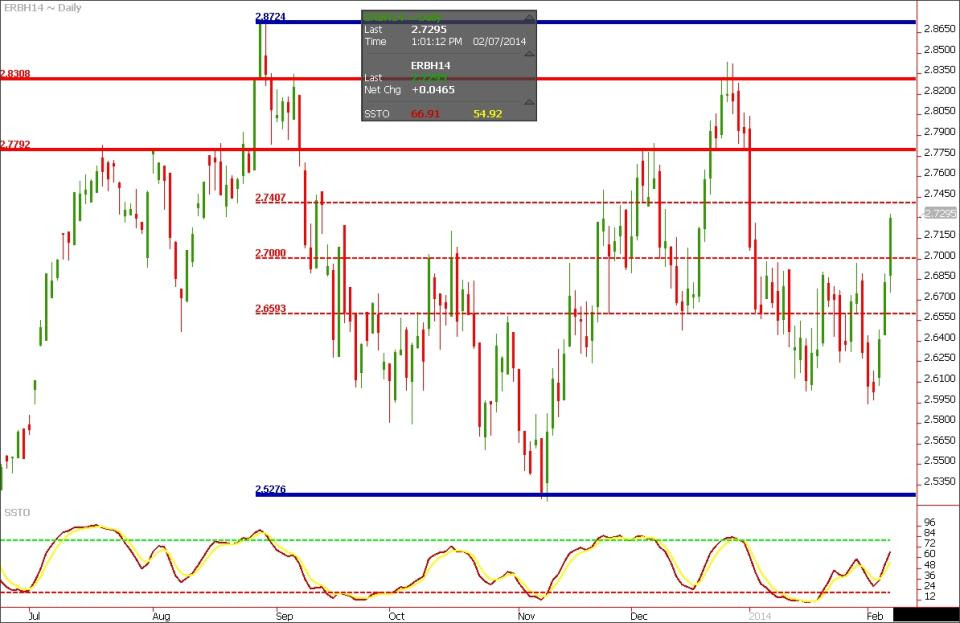
Below you will see two charts: Natural gas and Unleaded gasoline. I am looking at a bearish trade ideas in natural gas and bullish ideas in RBOB.
Natural gas prices spiked on 2/5 trading above $5.70 in March futures but since prices have lost nearly $1 and retraced to their 38.2% Fibonacci level giving up 17.5%. Weather forecasts project warmer weather in the coming weeks which will have the effect of easing demand. It is my opinion that we have passed the worst of the cold weather for the season...maybe that's just my wishful thinking being a Chicago resident.
I anticipate a trade back near $4.25 in the coming weeks.
RBOB prices are higher by 5% in the last 3 sessions currently trading to their highest levels since
1/3.
Friday marked the first settlement above the 50-day MA in 5 weeks. RBOB appears to be getting support form a rise in ethanol RIN credits as well as reports of a refinery glitch in Port Arthur, TX. There is also a strong seasonal tendency that I have alluded to you in recent weeks of industry buying ahead of the summer gasoline season that also may be having spillover effects.
I am operating under the influence that an interim bottom has been established and futures will appreciate in the coming weeks. I suggest using the red horizontal line in the chart below to guide you on exits on bullish trade.
- English (UK)
- English (India)
- English (Canada)
- English (Australia)
- English (South Africa)
- English (Philippines)
- English (Nigeria)
- Deutsch
- Español (España)
- Español (México)
- Français
- Italiano
- Nederlands
- Português (Portugal)
- Polski
- Português (Brasil)
- Русский
- Türkçe
- العربية
- Ελληνικά
- Svenska
- Suomi
- עברית
- 日本語
- 한국어
- 简体中文
- 繁體中文
- Bahasa Indonesia
- Bahasa Melayu
- ไทย
- Tiếng Việt
- हिंदी
When Is Gas A Good Thing?
Published 02/07/2014, 03:38 PM
Updated 07/09/2023, 06:31 AM
When Is Gas A Good Thing?
Latest comments
Loading next article…
Install Our App
Risk Disclosure: Trading in financial instruments and/or cryptocurrencies involves high risks including the risk of losing some, or all, of your investment amount, and may not be suitable for all investors. Prices of cryptocurrencies are extremely volatile and may be affected by external factors such as financial, regulatory or political events. Trading on margin increases the financial risks.
Before deciding to trade in financial instrument or cryptocurrencies you should be fully informed of the risks and costs associated with trading the financial markets, carefully consider your investment objectives, level of experience, and risk appetite, and seek professional advice where needed.
Fusion Media would like to remind you that the data contained in this website is not necessarily real-time nor accurate. The data and prices on the website are not necessarily provided by any market or exchange, but may be provided by market makers, and so prices may not be accurate and may differ from the actual price at any given market, meaning prices are indicative and not appropriate for trading purposes. Fusion Media and any provider of the data contained in this website will not accept liability for any loss or damage as a result of your trading, or your reliance on the information contained within this website.
It is prohibited to use, store, reproduce, display, modify, transmit or distribute the data contained in this website without the explicit prior written permission of Fusion Media and/or the data provider. All intellectual property rights are reserved by the providers and/or the exchange providing the data contained in this website.
Fusion Media may be compensated by the advertisers that appear on the website, based on your interaction with the advertisements or advertisers.
© 2007-2024 - Fusion Media Limited. All Rights Reserved.

