When Charts Make Money And Talking Heads Get Slaughtered

Published 10/08/2014, 01:24 AM
Updated 05/14/2017, 06:45 AM
GTATQ
-

Shares of GT Advanced Technologies Inc (NASDAQ:GTAT) got crushed on the news that the company filed for Bankruptcy on Monday. If you are one of the many unfortunate CNBC viewers who blindly followed the advice of the talking heads and bought shares of GT Advanced Technologies Inc, clearly you are not in a good position. It is never fun to watch a stock you own collapse in such fashion. Shares of GT Advanced Technologies Inc ended the session down by 92.76%

As I heard the news, I quickly took a look at the daily chart of GT Advanced Technologies. As expected, the chart of GT Advanced Technologieswas a screaming short (not something any knowledgeable trader/investor would buy). 

Stock patterns and the trend for any given equity is something every investor/trader should learn and understand before entering any kind of trade. Whether it is a long or short term investment, the chart and news are a perfect example of this. As you can see in the chart below, GTAThad a clear trend line break down on September, 10th (as highlighted by the white oval).

There were many factors suggesting that this equity would drop a significant amount. Among others, please note how this particular stock was trading below the 20, 50 and 200 moving averages; a clear sign of a downtrend and a weak technical position. This is the first warning sign not only for shares of GT Advanced Technologies but for any equity. On September 15th, the stock confirmed below the red trend line, signaling that a collapse was imminent. As the 20 day moving average came into price (yellow line) shares of  GTAT received the final spark needed for a massive drop. Stock charts never tell us what the catalyst will be, but they enable us to position ourselves on the right side of the trade, with a high rate of success when read correctly.
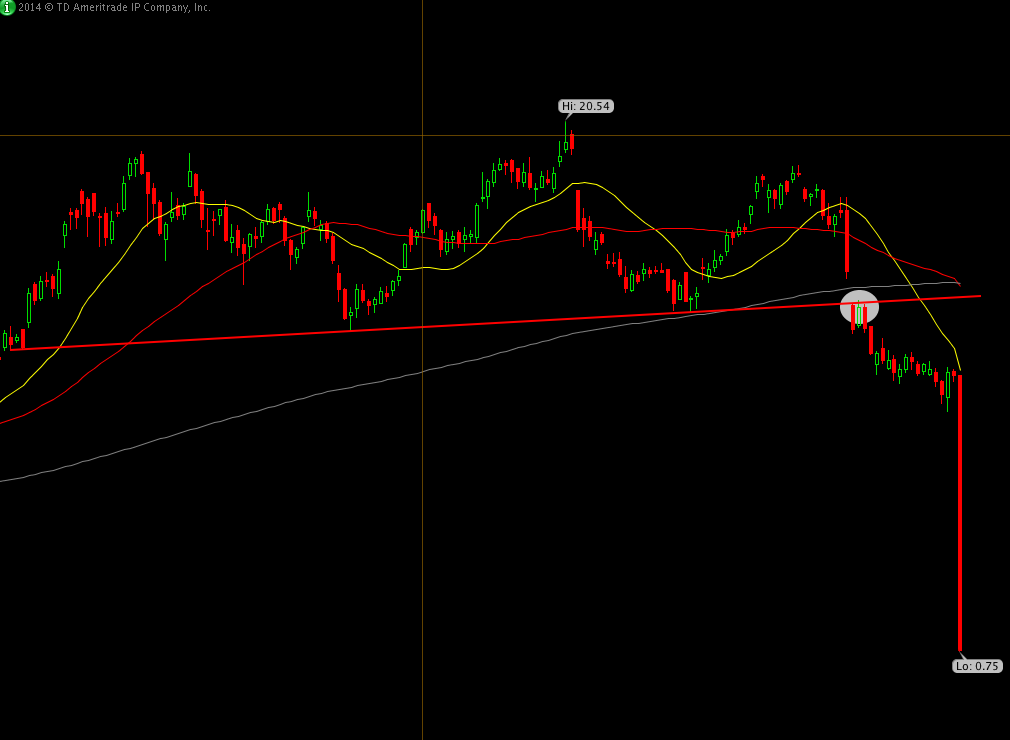
GTAT Breakdown

BY Kiliam Lopez

Original post

Latest comments

Loading next article…
Risk Disclosure: Trading in financial instruments and/or cryptocurrencies involves high risks including the risk of losing some, or all, of your investment amount, and may not be suitable for all investors. Prices of cryptocurrencies are extremely volatile and may be affected by external factors such as financial, regulatory or political events. Trading on margin increases the financial risks.
Before deciding to trade in financial instrument or cryptocurrencies you should be fully informed of the risks and costs associated with trading the financial markets, carefully consider your investment objectives, level of experience, and risk appetite, and seek professional advice where needed.
Fusion Media would like to remind you that the data contained in this website is not necessarily real-time nor accurate. The data and prices on the website are not necessarily provided by any market or exchange, but may be provided by market makers, and so prices may not be accurate and may differ from the actual price at any given market, meaning prices are indicative and not appropriate for trading purposes. Fusion Media and any provider of the data contained in this website will not accept liability for any loss or damage as a result of your trading, or your reliance on the information contained within this website.
It is prohibited to use, store, reproduce, display, modify, transmit or distribute the data contained in this website without the explicit prior written permission of Fusion Media and/or the data provider. All intellectual property rights are reserved by the providers and/or the exchange providing the data contained in this website.
Fusion Media may be compensated by the advertisers that appear on the website, based on your interaction with the advertisements or advertisers.
© 2007-2025 - Fusion Media Limited. All Rights Reserved.