Investing.com’s stocks of the week
The retail massacre is well documented.
Most recently, on August 30, 2017, I said…
In the past, as long as your store enjoyed 1) a courteous staff, 2) competitive pricing and 3) a good location — all was well. But today? Those three metrics — standing alone — would put you out of business in six months. If not sooner. And on the heels of Amazon’s (NASDAQ:AMZN) acquisition of Whole Foods, investors are convinced that every retailer is in Amazon’s cross hairs.
Since a picture is worth a thousand words, I’d like to show you a chart that has gone absolutely insane!
Below, you can see the historic rash of bankruptcies being suffered by retailers.
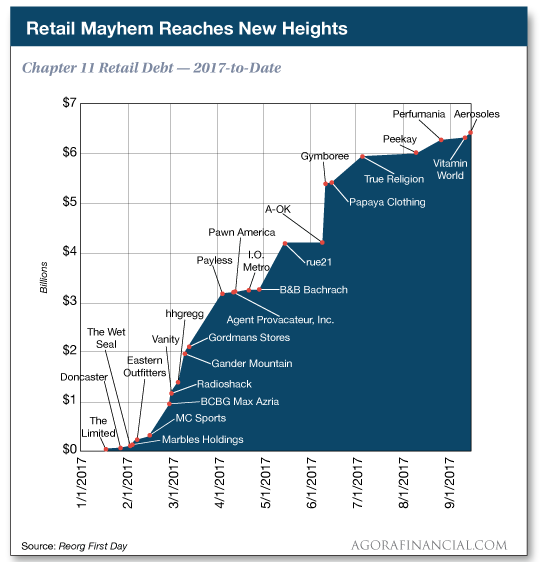
More retail carnage is coming, too — I guarantee it.
But the takeaway here is this…
When charts go insane, the insanity always brings forth an opportunity to profit.
As you’re about to witness, these profits oftentimes come hard and fast.
Let me explain…
1,000% Gains… Without Using Risky Options or Derivatives
I want you to take a look at this chart…
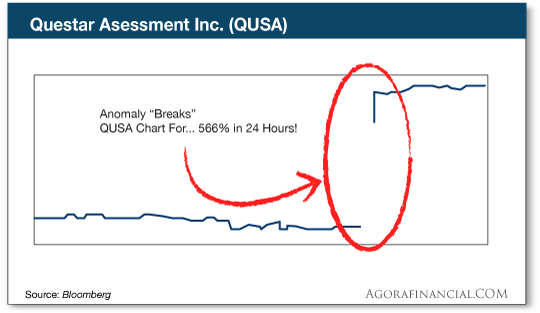
Does this line in the chart look normal to you?
Of course not…
As you can see, the stock went up so far and so fast, it literally “broke” the line on the chart!
And this stock hand delivered 566% gains in the markets.
I call this image a “chartbreaker.” And it’s your key to potentially making a fortune for the rest of 2017.
But what exactly is a chartbreaker?
It’s a little known “glitch” in the markets that sends stocks soaring so far… so fast… it literally BREAKS their charts…
Unleashing HUGE windfalls approaching 1,000% or higher…
And get this…
What makes this opportunity completely different than anything you’ve seen before is the pure speed in which these gains occur…
Instead of normal stock charts, where the lines can slowly rise higher by the day… These chartbreakers soar so quickly the lines on the chart literally can’t keep up…
And the charts “break…”
Let me show you just how powerful this wealth-building secret can be…
Consider just these THREE stocks…
In just 24 trading hours…
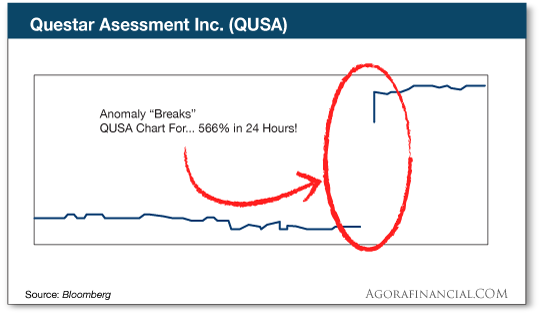
There was the 566% winner on Questar Assessment Inc. (QUSA)…
Which literally sent the stock up so fast it “broke” its chart, as you see here…
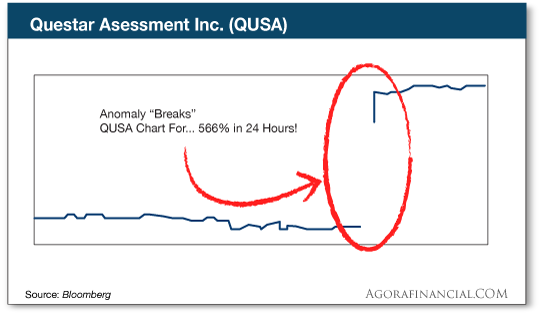
And which could’ve almost instantly turned every $10,000 invested into $66,600.
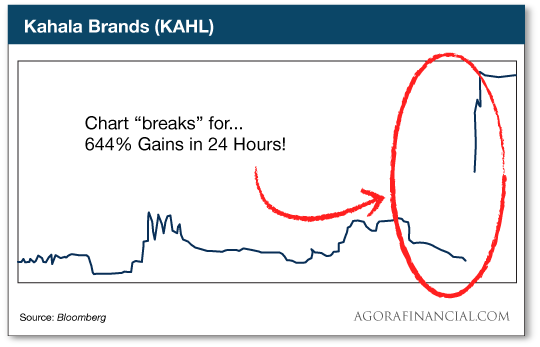
There was the 644% gainer on Kahala Brands (KAHL)…
Which, again, sent the stock up so fast the chart broke…
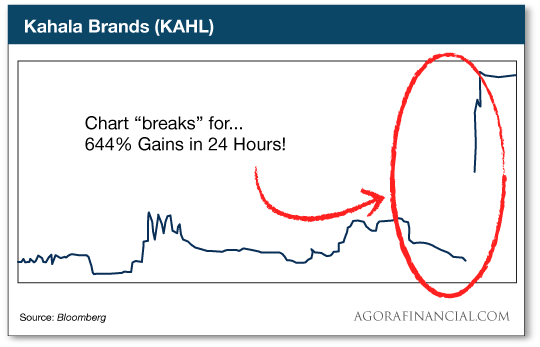
And could’ve grown your money from $10,000… to $74,400.
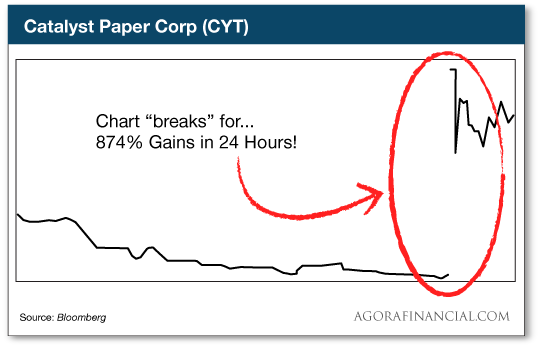
Then there was the 874% on Catalyst Paper Corp (CYT)…
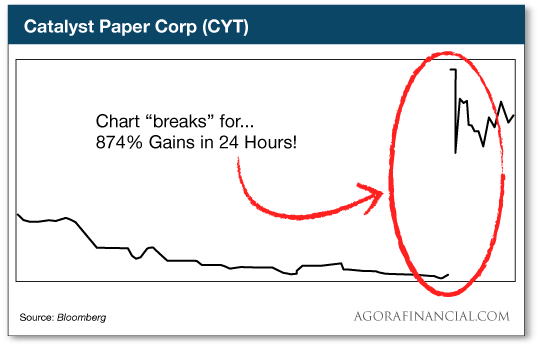
That chartbreaker could’ve handed you a whopping $87,400 profit… from a simple $10,000 investment…
Had you simply put $10,000 in each of these rare investments… you could’ve walked away $208,400 richer.
Best of all, all those gains which could’ve been achieved using my chart-breaking strategy… came from regular stocks.
You’ll see that these chartbreakers happen about once a day, on average, for the past decade.
For example…
All the way back in 2006, the glitch that drives these chartbreakers hit 584 times!
That’s more than one chance every single day to make a fortune.
And it’s continued throughout bull and bear markets…
In 2008, one of the worst markets of our lifetimes, you still would’ve had 366 shots to use these chartbreakers to amass wealth.
And last year when the DOW drove to new heights, this worked again…
Handing you 350 chances to “break” the chart and cash in with gains.
It’s like a treasure trove of profits for those who know where to look.
The truth is that there are 376 opportunities — each year, on average — to exploit this glitch for 24-hour windfalls approaching 1,000%.
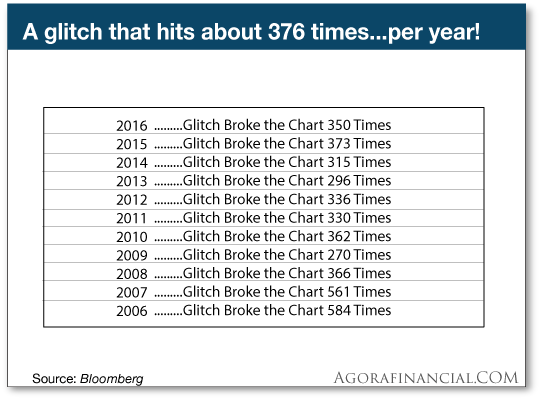
That means essentially every day you have the chance to get very rich from one of these chartbreaker stocks that goes vertical…
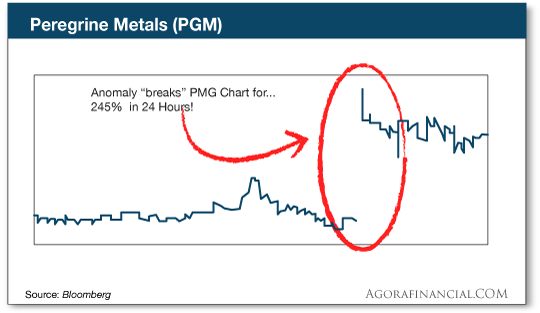
Like on July 8, 2011…
That day Peregrine Metals (PGM) broke its chart for a 245% gain…
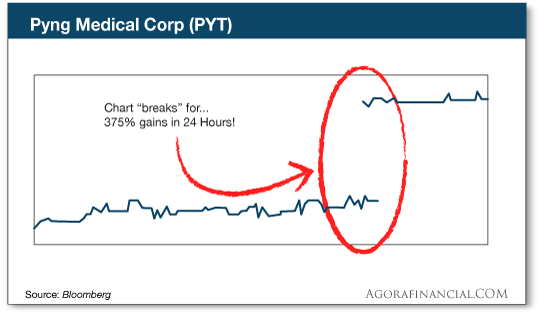
Or on February 3, 2017…
When Pyng Medical Corp (PYT) busted out for a 375% gain…
Or on August 4, 2015…
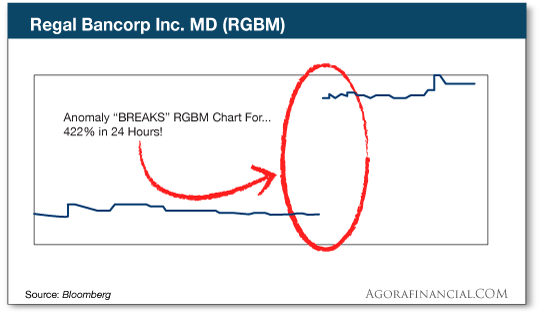
When Regal Bancorp (RGBM) let loose for 422%…
There was January 29, 2016…
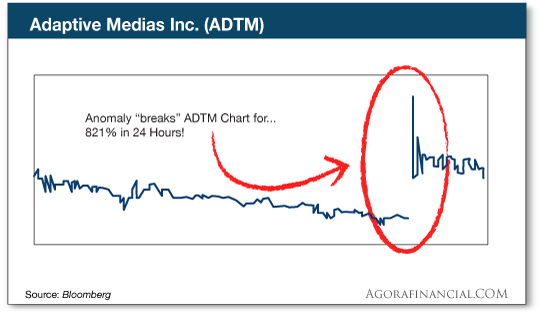
That day Adaptive Medias (ADTM) unleashed a 457% winner…
There was January 17, 2013…
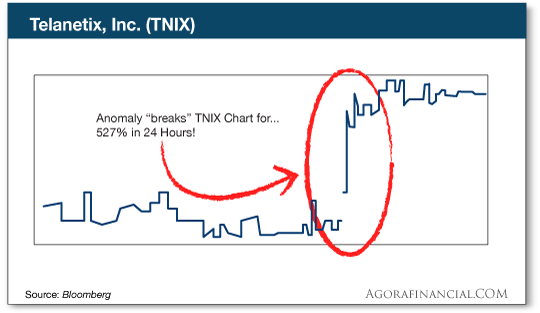
Where Telanetix (TNIX) broke off a 527% move…
There was January 5, 2017…
Where Questar Assessment (QUSA) soared for 566%…
Or how about September 19, 2016…
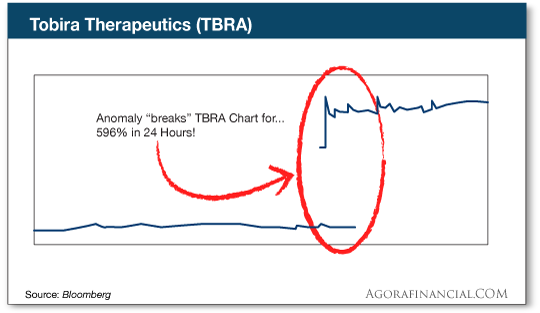
That’s when Tobira Therapeutics (TBRA) surged up 596%…
Or how about March 31, 2016…
The day that Kahala Brands (KAHL) delivered 644%…
Or July 10, 2013…
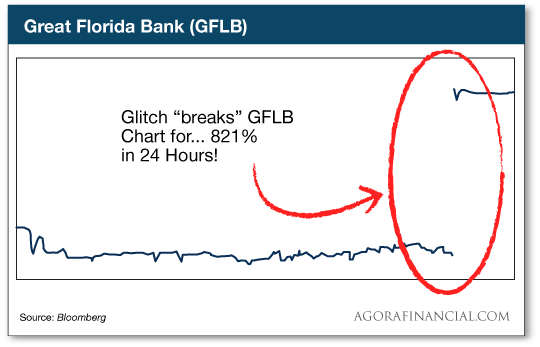
When Great Florida Bank (GFLB) racked up 821%…
And of course, my favorite, May 20, 2016…
When Catalyst Paper Corp (CYT) exploded upwards by a whopping 874%.
And that’s not even including the countless others… some of which I’ll list for you quickly here…
Straight Path Communications (STRP): 150% gain
Tecumseh Products (TECU): 155% gain
BankGreenville Financial (BGVF): 156% gain
Vitae Pharmaceuticals (VTAE): 156% gain
Mood Media Corp (MM): 166% gain
Sequenom (SQNM): 180% gain
Niska Gas Storage (NKA): 187% gain
Park Bancorp (PFED): 200% gain
Bank 1400 (BFFO): 218% gain
Dynatem (DYTM): 225% gain
Had you invested $10,000 in each of these winners…
You could’ve walked away with a ridiculous $831,000.
And collected the cash from each winner … just 24 trading hours later.
Are you starting to see how powerful these “chartbreakers” can be?
But maybe you’re wondering…
If this strategy is so great, why not just keep it to myself? Why share with you at all?
Tune in tomorrow, when I’ll show you why I’ve decided to “go public” with this amazing new strategy.
Ahead of the tape,
