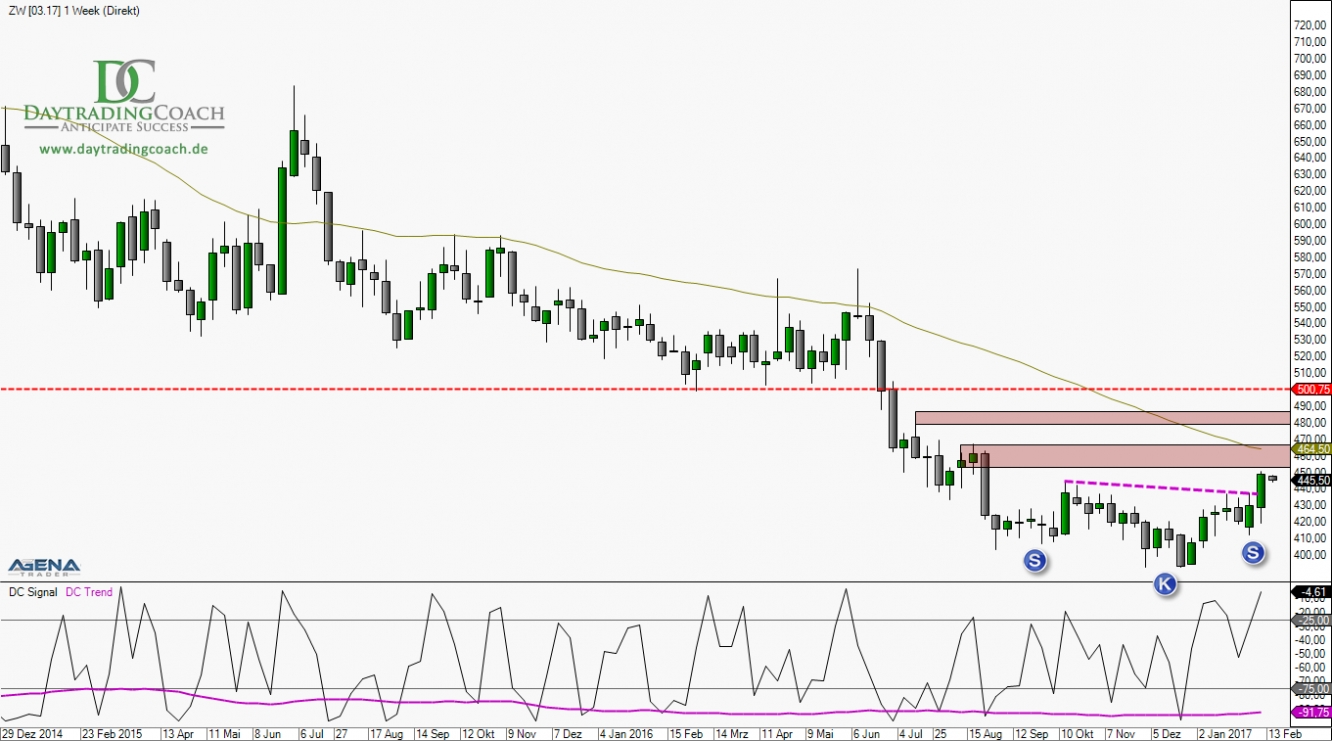
Although wheat is still clearly pointing downwards in the weekly chart, a healthy upward trend has presently formed in the daily chart. What continues to stand out in the weekly chart is the concluded inverse head and shoulders formation – a typical trend reversal formation that frequently finalizes a mid-term bottom formation. After the breakout last week, this constellation provides a price target in the chart at approx. 485 cents. The next larger resistance, however, is already in the zone around 455 to 465 cents. Here, the rally could come to a halt for the time being. A further aggravating factor is that the long-term 52-week average is also running through the area around 465 cents.
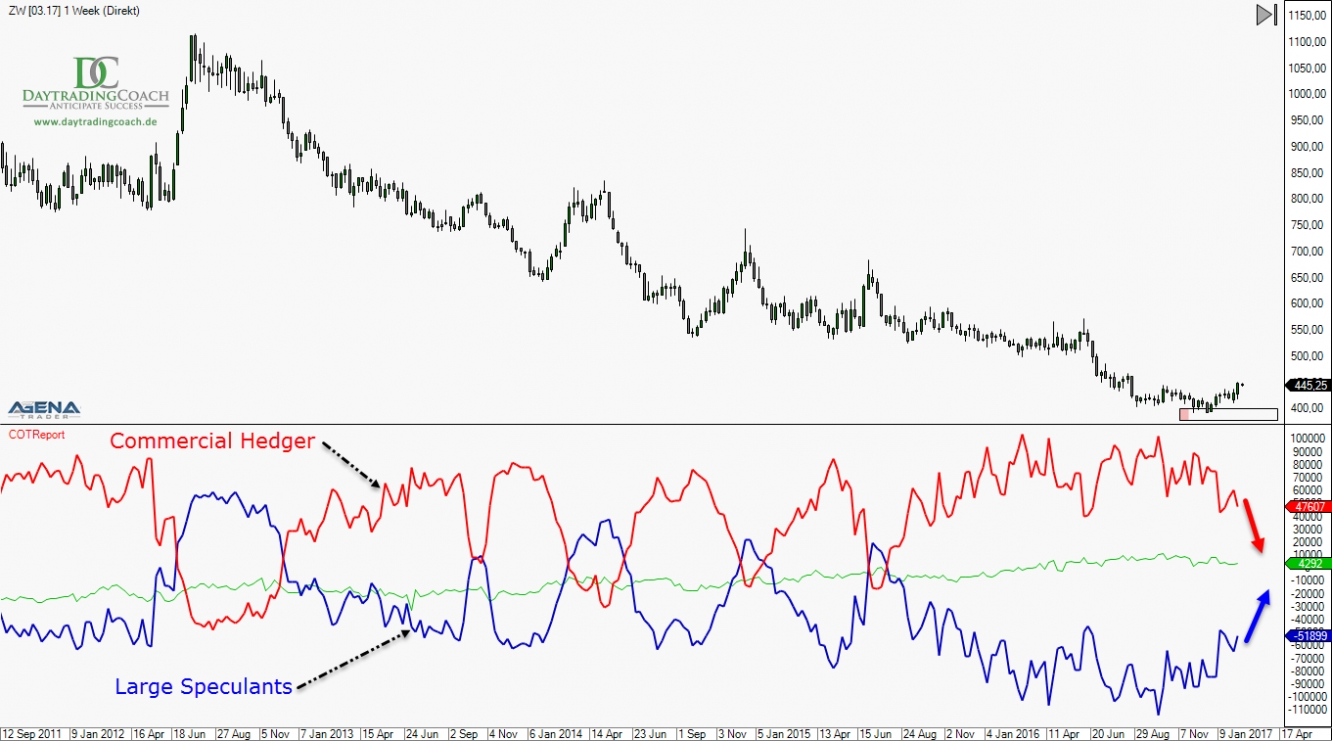
The Commitments of Traders data also supports the current upward move in wheat. The data, which was published on Friday, shows a change on the net short side of the funds and hedge funds from -64.074 contracts to -51.899. This is, after all, a 20% change in one week. On the other hand, the commercials are continuing to dismantle their net long positions. Both sides still have plenty of space until the old extreme values, which is confirmed by the long-term correction potential up to 500 cents or above
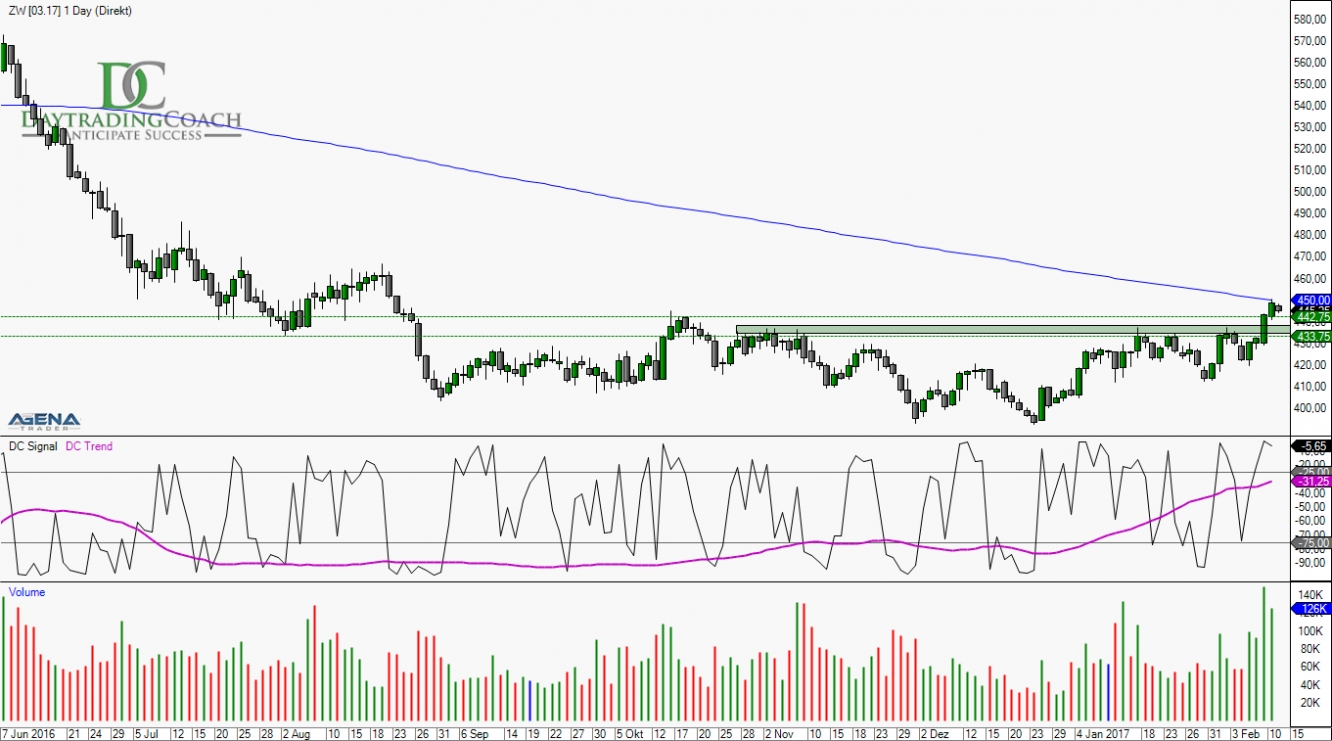
For now, although wheat has got stuck at the closely watched 200 SMA (simple moving average) in the daily chart, shown in blue in the chart, a setback could definitely enable an interesting long entry. The trend in the daily chart is healthy, and has been running cleanly upwards with nice corrections since the middle of December. My short-term DC trend indicator also exited the short area in the beginning of January of this year, and has been running clearly in a long setup since then.
The next strong support area is located between 435 and 440 cents. However, a stop should be placed beneath the 420 cents marker, since the current upward trend would come to an end there. At the latest from that point onwards, the old upward trend would then be intact once more in all time frames.
I wish you continued success with your trading!
IMPORTANT NOTE:
Exchange transactions are associated with significant risks. Those who trade on the financial and commodity markets must familiarize themselves with these risks. Possible analyses, techniques and methods presented here are not an invitation to trade on the financial and commodity markets. They serve only for illustration, further education, and information purposes, and do not constitute investment advice or personal recommendations in any way. They are intended only to facilitate the customer’s investment decision, and do not replace the advice of an investor or specific investment advice. The customer trades completely at his or her own risk.
