Trade potentials usually do not announce themselves. They have to be ferreted out. We have been tracking wheat for several weeks because of how developing market activity is responding at current low levels.
Charts represent the language of the markets, depicting every level of market participant, from the market movers to fundamentalists, technicians, the highly informed, and even those who have no clue what they are doing. Once a decision is made to buy or sell, it is registered permanently in chart form, and everybody gets to see the developing activity at the same time. Nothing is hidden.
There is a fine line between picking bottoms and finding low-risk trades near a bottom. The determining factor is the market itself in the "message" it sends for anyone who cares to see it. Whenever there is an unusual increase in volume, it typically comes from what we will call "Smart Money," those who are the most informed and have the ability to move a market directionally.
There has been a notable pick-up in volume, of late, and we attribute it to the smart money movers. It is best seen on the charts to better relate to what it can portend. We always like to start with a weekly time frame to get an overall view of market development. It is the starting point for this analysis.
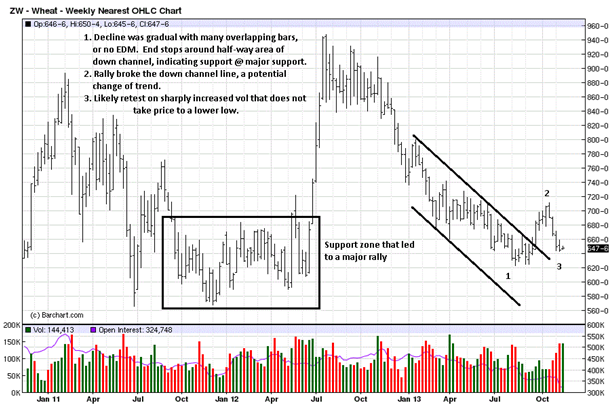
The rally which began in June of 2012 took off like a rocket from a launching pad, but it did so after a period of basing, starting from June 2011. We boxed most of that activity and labeled it as a support zone. If you compare the EUM, [Ease of Upward Movement], reaching the high in 2012, to the decline into August/September of 2013, price was much more labored going down. In part, it was a result of a liquidating market, and one which punished longs all the way down.
Not drawn on the chart, but worth mentioning as a prelude to the low scenario we are advancing, is how the downward effort shortened considerably. From the breakdown out of the TR, starting in late November, 2012, to the low in April of this year, the decline was around $1.80.
From April, price moved sideways until the end of June, when the down trend resumed, again. The distance from that breakdown to the recent low is only about $.75. Both time and price were shortened, and that alone can lead to a change in trend. Keep in mind, a change in trend can be the ending of the down trend to sideways, not necessarily a full reversal to up.
With that in mind, note the location of the low, at 1, relative to the bottom channel line. Price stopped at about a half-way retracement within that channel and then proceeded to move sideways. A few weeks later, the upper channel, resistance, was broken as price rallied above, stopping at 2.
At 1, volume increased sharply for two weeks. Compare the first high volume bar, a wider range down with a poor close, to the second high volume bar. The range was much smaller and the close was just under mid-range of the bar. We know zero about fundamentals, like crop size, weather, growing conditions, etc., but when it comes to reading a chart, that's I our arena, for we know about charts, and those two weeks just gave us added information.
The reason why the second bar was smaller was because buyers were supporting the market, taking the offerings from sellers, thus preventing the price range from extending lower. You can be sure buyers were just as active in the first high volume weekly bar, but a second week was needed to absorb the effort from sellers. We know this also from the location of the close, just slightly lower from the previous week, a victory for the buy side.
Where did this battle take place? Right at the same level of established support to the left, the large box area. The little pieces of the developing activity are starting to reveal a story different from how most viewed the wheat market, at the time, and even currently. The rest of the developing story, at point 3, is taken up on the daily chart.
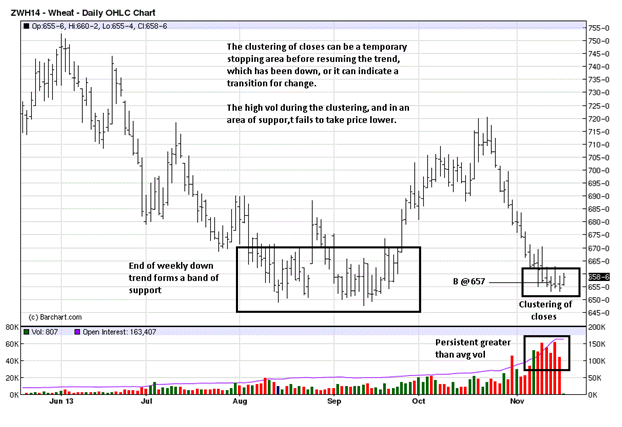
The large box in the middle is area 1 from the weekly. The rally to 7.20 in October is 2. A clustering of closes is explained on the chart, and formed at 3. It has developed right at support from the left. What is most notable is the sharp increase in volume and the total lack of downside follow-through from all that effort. This is why it makes the most sense to conclude the clustering will lead to change, rather than continuation.
Think of that clustering as an Ali Rope-a-dope, where Mohammed Ali covered his face with his arms, pretending to be trapped on the ropes, and he let George Forman punch away. Ultimately, there was no harm to Ali, but it tired Forman, who had spent all his energy, and he was knocked out by Ali in the 8th round. [Rumble in the Jungle, 1974].
At area 3, it appears that sellers may have expended themselves and may now be trapped. For all the reasons cited, we recommended a long position, last Wednesday, at 657. The risk is a stop under recent lows. Our view is that the developing market activity is an attempt by smart money to disguise their hand. However, they cannot escape the foot prints left behind, in the form of price and volume.
Can we be wrong? Absolutely! It is a probability trade at what can be called a danger point, but it is also where the risk is generally lower. The reward potential is far greater than the risk. Time will tell.
- English (UK)
- English (India)
- English (Canada)
- English (Australia)
- English (South Africa)
- English (Philippines)
- English (Nigeria)
- Deutsch
- Español (España)
- Español (México)
- Français
- Italiano
- Nederlands
- Português (Portugal)
- Polski
- Português (Brasil)
- Русский
- Türkçe
- العربية
- Ελληνικά
- Svenska
- Suomi
- עברית
- 日本語
- 한국어
- 简体中文
- 繁體中文
- Bahasa Indonesia
- Bahasa Melayu
- ไทย
- Tiếng Việt
- हिंदी
Wheat Developing Trade Potential
Published 11/18/2013, 12:02 AM
Updated 07/09/2023, 06:31 AM
Wheat Developing Trade Potential
Latest comments
Loading next article…
Install Our App
Risk Disclosure: Trading in financial instruments and/or cryptocurrencies involves high risks including the risk of losing some, or all, of your investment amount, and may not be suitable for all investors. Prices of cryptocurrencies are extremely volatile and may be affected by external factors such as financial, regulatory or political events. Trading on margin increases the financial risks.
Before deciding to trade in financial instrument or cryptocurrencies you should be fully informed of the risks and costs associated with trading the financial markets, carefully consider your investment objectives, level of experience, and risk appetite, and seek professional advice where needed.
Fusion Media would like to remind you that the data contained in this website is not necessarily real-time nor accurate. The data and prices on the website are not necessarily provided by any market or exchange, but may be provided by market makers, and so prices may not be accurate and may differ from the actual price at any given market, meaning prices are indicative and not appropriate for trading purposes. Fusion Media and any provider of the data contained in this website will not accept liability for any loss or damage as a result of your trading, or your reliance on the information contained within this website.
It is prohibited to use, store, reproduce, display, modify, transmit or distribute the data contained in this website without the explicit prior written permission of Fusion Media and/or the data provider. All intellectual property rights are reserved by the providers and/or the exchange providing the data contained in this website.
Fusion Media may be compensated by the advertisers that appear on the website, based on your interaction with the advertisements or advertisers.
© 2007-2024 - Fusion Media Limited. All Rights Reserved.