The latest in the whipsaw that is the gold market sees the shiny rock moving higher again. Will it stick this time? Or will it pull another head fake and make a higher high only to give it up and fall back again? The boomerang market has been in full swing. Lets take a look and try to glean some insights.
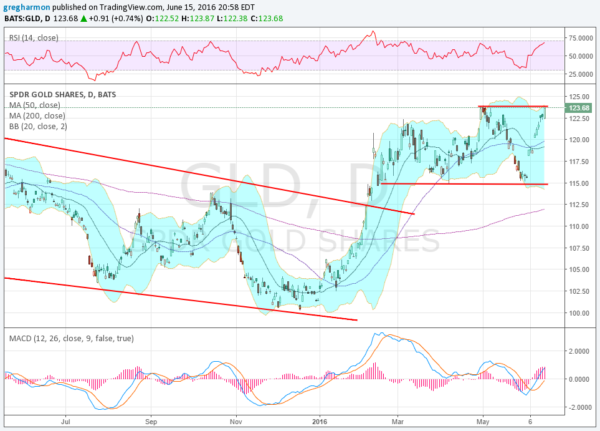
The chart below shows a pretty well defined break out of the downtrending channel and consolidation on a wider scale. It has been the week to week movements that wreaked havoc. A jump to 122.50 and then a pullback to 115. The following movement back up to 123.85, a higher high. But it could not hold and fell right back to 115. And then with consolidation and negative momentum indicators it reversed and rocketed back to the prior high.

The chart shows SPDR Gold Shares (NYSE:GLD) making a strong move Wednesday that would suggest follow through Thursday to another higher high. Momentum has shifted back to the upside. The RSI is back in the bullish zone and rising and the MACD is moving up. Even the Bollinger Bands® are opening to the upside. Options open interest is shows big numbers at 123 and 125 with 124 next and active. These suggest it should not move much the rest of the week and may also have an upward bias.
So goes the latest read of the gold chart short term. Intermediate and long term charts are clear, consolidation after a break of the downtrend. Lets see if the short term read stick this time.
The information in this blog post represents my own opinions and does not contain a recommendation for any particular security or investment. I or my affiliates may hold positions or other interests in securities mentioned in the Blog, please see my Disclaimer page for my full disclaimer.
