Street Calls of the Week
Many short-term traders have caught the bounce off of a January low in the emerging markets ETF (NYSE:EEM). To them I say, 'congratulations'. But if you're not one ofthem you may be wondering about the longer-term view. Sure, a 25% run higher is nothing to scoff at. But it still sits 30% below the 2011 high near 50. Is there more?
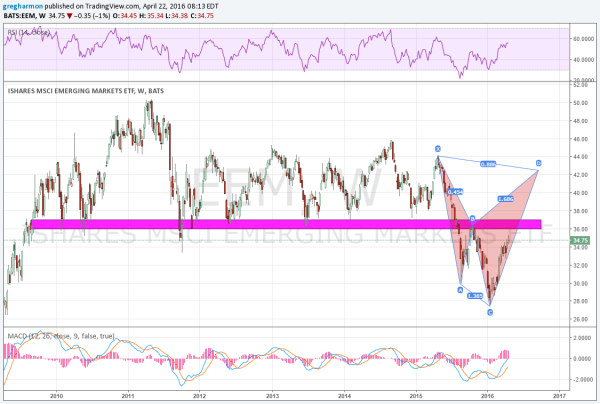
This weekly chart suggests that a test of critical long-term resistance may be at hand. The area between 36 and 37 acted as support for 6 years until the price broke below it in mid 2015. The first retest of that area -- as resistance at the end of 2015 -- came up empty. In fact it led to a new lower low.

The next test could end up differently. Why? First, both momentum indicators are running stronger than when the price hit that test last year. Both the MACD and RSI are about to cross into the bullish zone, so they both have room to run higher. If the price can make a higher high -- over the 36.42 level from October and through 37 -- then it gets interesting.
At that point it would confirm a Shark harmonic pattern, which would look for a run higher to 42.50 as a first target and then 46 upon continuation. That move above 37 would also give a natural stop-loss level to hold the ETF against. So if you missed the initial run, you may have something to look forward to as it emerges from the ground this spring.
