After a frenzy of Reddit induced activity that captivated everyone, silver painfully gave back what it gained. What’s next for the white metal?
As the precious metals’ version of moral hazard, silver tipped over the flowerpot, and left gold to clean up the mess. After silver’s short squeeze mania ended in tears on Feb. 2, the white metal gave back 97% of its squeeze-induced gains. Conversely, bearing the brunt of the market’s wrath, gold gave back 237% of the momentum-induced gains.
Please see below:
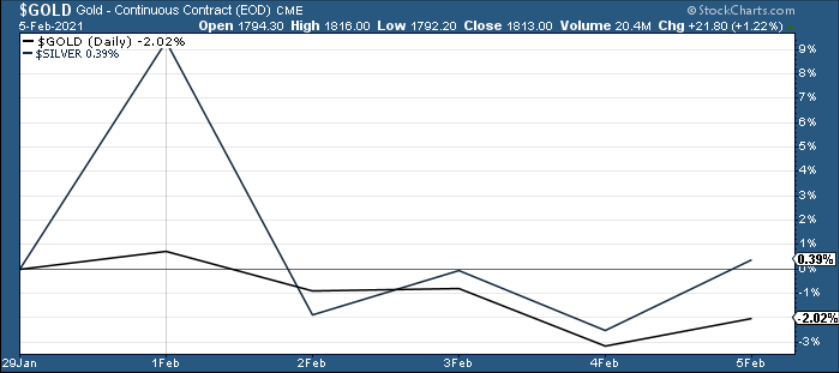
Figure 1
As a result, silver is doing what it normally does near market tops: outperforms among comments regarding silver shortage.
Positioning itself for an epic blow-off top, silver’s Feb. 1 surge ended in less than 24 hours. In addition, silver is approaching two triangle-vertex-based reversal points – which could come to a head by the end of February or early March. However, given the two set ups, they could be signalling one climactic reversal or two separate reversals of differing magnitudes. As it stands today, it’s still too early to tell.
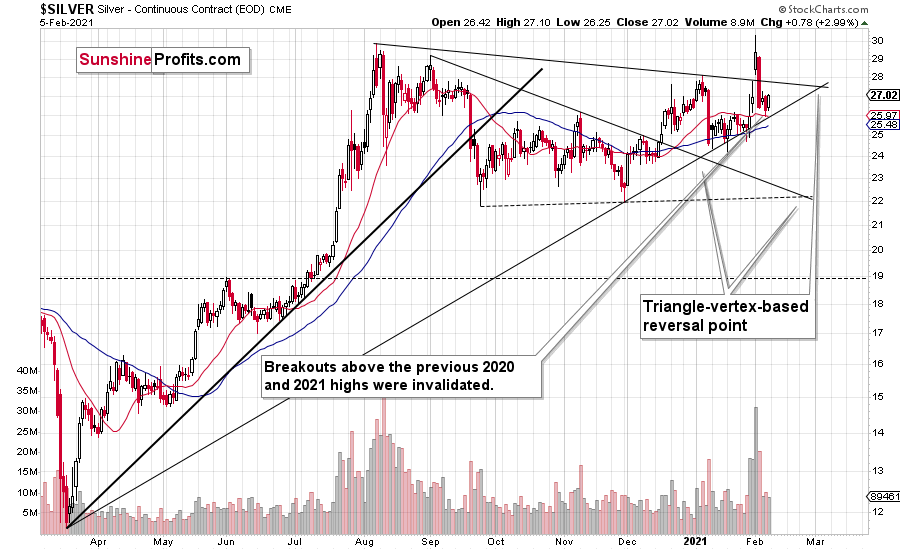
Figure 2 - COMEX Silver Futures
However, supporting the argument of a single blow-off top, I mentioned last week that the iShares Silver Trust (NYSE:SLV) took in nearly $1 billion in daily inflows on Jan. 29. For context, that was nearly double the previous record.
Please see below:
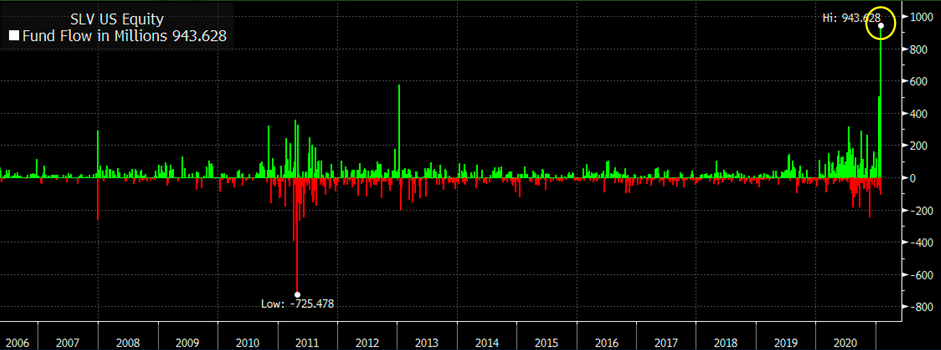
But because too much of a good thing can often be bad, the frantic buying mirrored an ominous period in SLV’s history.
Please see below:
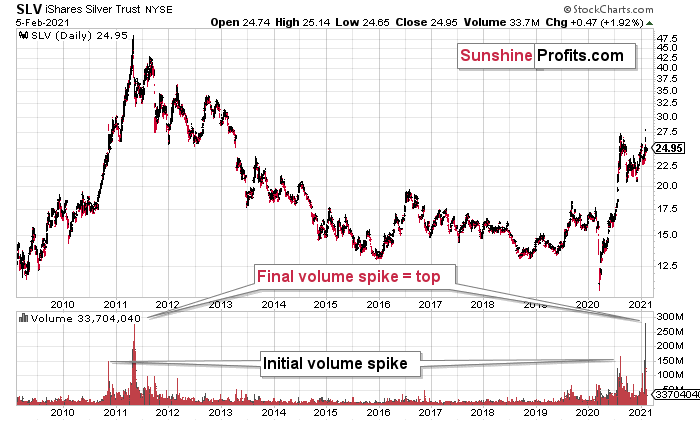
Figure 4 - COMEX Silver Futures
If you analyze the volume spikes at the bottom of the chart, 2021 and 2011 are a splitting image. To explain, in 2011, an initial abnormal spike in volume was followed by a second parabolic surge. However, not long after, silver’s bear market began.
SLV-volume-wise, there's only one similar situation from the past – the 2011 top. This is a very bearish analogy as higher prices of the white metal were not seen since that time, but the analogy gets even more bearish. The reason is the "initial warning" volume spike in this ETF. It took place a few months before SLV formed its final top, and we saw the same thing also a few months ago, when silver formed its initial 2020 top.
The history may not repeat itself to the letter, but it tends to be quite similar. And the more two situations are alike, the more likely it is for the follow-up action to be similar as well. And in this case, the implications for the silver price forecast are clearly bearish.
Based on the above chart, it seems that silver is likely to move well above its 2011 highs, but it’s unlikely to do it without another sizable downswing first.
In conclusion, if silver meets its maker, the white metal is likely to lead gold and the miners to slaughter. Moreover, silver is well known for its false breakouts and its relative strength is often a precursor to substantial declines. As a result, last week’s short squeeze was much more semblance than substance. In contrast, once the metals rebase and trade at more appropriate levels, an attractive buying opportunity will emerge.
For more insight, let’s look at the relative performance of gold, silver and the gold miners, and compare how they’re impacted by the USDX and the SPX. If you analyze the chart below, you can see that the precious metals all broke down in September, after the USDX broke above resistance.
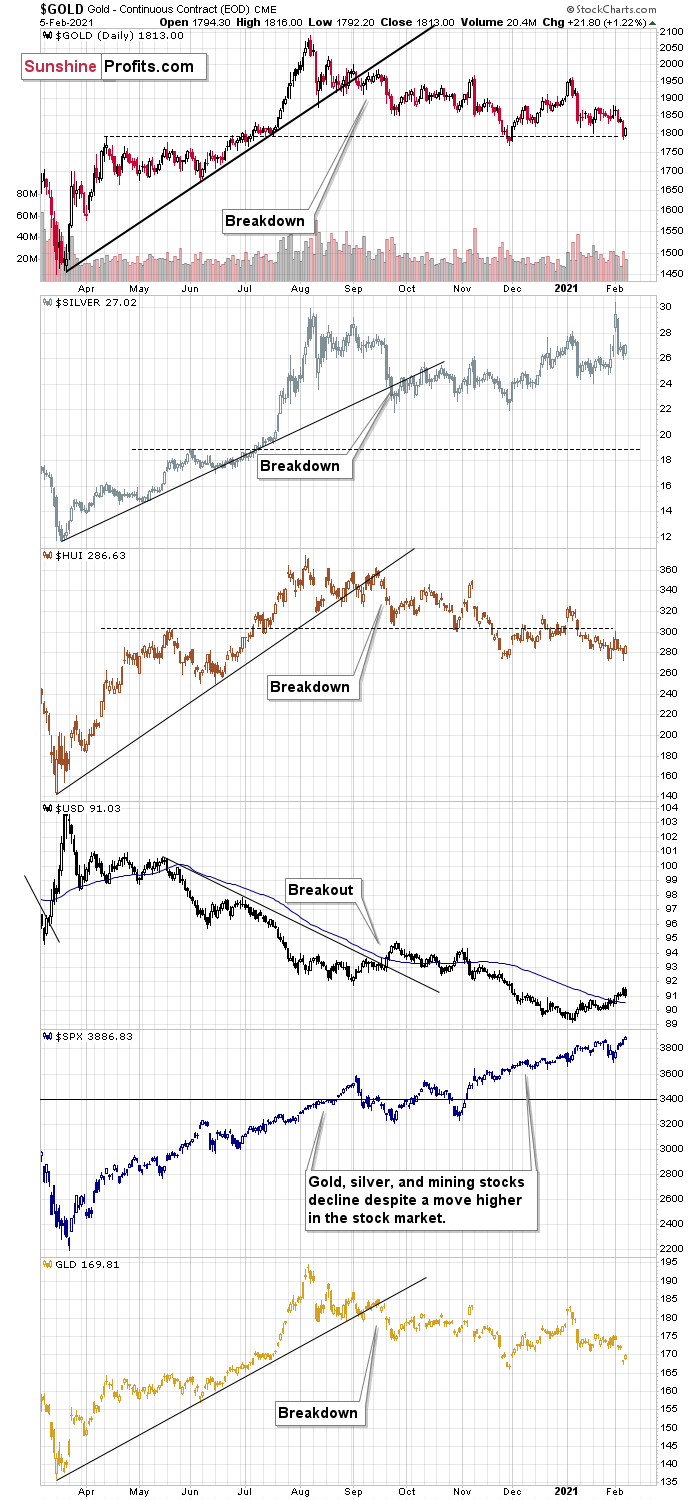
Figure 5
To explain, I wrote on Jan. 18:
Like traffic lights flashing red, notice how the HUI Index (proxy for gold stocks) is trading well below its early 2020 highs? In stark contrast, gold remains moderately above its early 2020 highs, while silver is significantly above its early 2020 highs. The misaligned performance – with silver outperforming and gold miners underperforming – puts a bow on this bearish package.
The bottom line?
It is not only the case that silver was strong and miners were weak in the last several days – it’s been the case over the past several months as well. The implications are bearish.
Also troubling is that the stock market that’s soaring in the medium term, hasn’t shined its light upon the precious metals market. Contrasting the mantra that ‘a rising tide lifts all boats,’ equity market strength hasn’t triggered a sustainable rally in silver or the gold miners. And this “should have” been the case – both are more connected to stocks than gold is. Gold stocks because they are, well, stocks, silver, due to multiple industrial uses.
All in all, based on what we saw in silver recently, it doesn’t seem that we’re likely to see much higher precious metals prices without seeing a major decline first.
