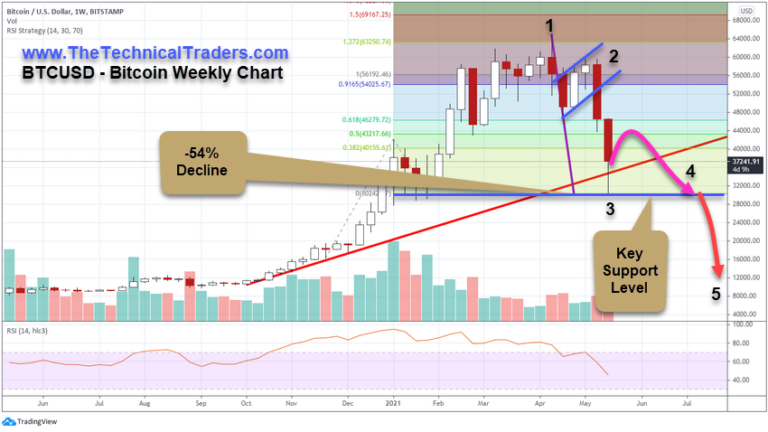
The recent breakdown in Bitcoin has, in my opinion, completed the Third Phase of our Excess Phase Top pattern—the breakdown of the Price Flag (2) into a price decline setting up intermediate support (3). At this point, we can expect a moderate bounce in price from the lows near $30,066. This upside price trend from the 3 support level should be interpreted as a “relief rally” or bounce in price after reaching support. It is typically followed by many days or weeks of sideways trending that eventually results in a retest of the 3 support level. This is followed by a subsequent breakdown in price that will attempt to identify the true, ultimate bottom in price.
Be Prepared For The Remainder Of The Excess Phase Peak Pattern In Cryptos. Don’t Get Greedy!
When my research team and I first highlighted this extended type of price pattern, in late 2020. We suggested the following five price phases make up the Excess Phase Peak setup and ultimately result in a deeper (ultimate) price low that acts as a bottom in the markets.
- The Excess Phase Rally must push price levels to new highs.
- A breakdown in price from the Excess Phase Peak sets up a FLAG/Pennant recovery phase. This represents the first attempt at a recovery that eventually fails
- A breakdown in price from the FLAG/Pennant price recovery phase creates the real first opportunity for short traders or those that executed timely Put options. This represents the first real downward price trend after the FLAG setup.
- Phase 3 sets up the Intermediate-term support level. This becomes the last line of defense for price—an intermediate-term price floor. This phase can take quite a while to complete as traders often still believe a new rally will resume—thus, this support level often has quite a bit of momentum to breakdown before it eventually fails.
- The final breakdown of price below the Phase 4 support level usually begins a much deeper sell-off. This is usually when other factors in the markets have finally resulted in the realization that the excess phase is over.

We believe a moderate relief rally will push Bitcoin price levels back above $41k before a more extended downward price trend continues to drive prices back toward the $30k level over the next 5+ weeks. Depending on how quickly the Phase 4 sideways price trending exhausts itself, we may see some type of broad breakdown on Cryptos before the end of July 2021—time will tell.
Our current expectation is that a deeper low will setup, possibly somewhere near or below $12k, throughout the rest of 2021. This attempt to find an ultimate price low may carry into 2022 if the Excess Phase Peak pattern extends out over time.
Traders should expect some big volatility within this Phase 4 trending. The sideways price trending will eventually weaken and begin to trend downward as the support level, near $30k, comes under pressure. Overall, we believe there is enough confirmation of the Excess Phase Peak pattern at this point to assume Bitcoin and Cryptos are going to continue to complete the Excess Phase Peak pattern and ultimately attempt to break downward to find the “Ultimate Bottom”. This is where a real opportunity for another rally attempt will setup. Be patient and trade cautiously as this pattern continues to unfold.
