With several days of accumulation in most currencies, a ramp up in volatility is badly needed for traders to spot fresh opportunities in the Forex market. The yen and bond yields continue to telegraph the market is far from being out of the woods in the corona virus-related growth concerns, while equities trade at the beat of its own drum, disconnected from fundamentals.
Quick Take
As Forex traders, volatility is the oxygen we need, and judging by the last 48h, the market has certainly strangled us by missing this critical component. On Monday, with the exceptions of the British Pound and the Canadian Dollar, the rest of the G8 FX complex traded in a rather ‘comatose’ state, even if that should not surprise nobody, as the US equity and bond markets were closed in observance of President’s day. In the first hours of trading in Asia this Tuesday, looks like vol is starting to return though.
The GBP was the weakest currency on Monday, as the UK’s Brexit negotiator David Frost reminded the market once again of the big stumbling blocks that lie ahead in the negotiations for future trading relationships with the EU. Britain said it will not sign up to follow EU standards because it would defeat the point of Brexit, while the EU maintains a hardline stance in ‘the level playing field’ that the UK must respect in accordance with EU laws. A rather bold yet representative statement of where they both stand came from the French foreign minister who warned of the tough EU-UK negotiations ahead by noting “EU-UK will rip each other apart” in trade talks.
The Canadian Dollar, amid the lack of one single attributable catalyst, keeps being fueled by technical bullish momentum, and is about to surpass the Swissy in performance terms since Jan 21, the defining data when the coronavirus outbreak made it to the mainstream media. It’s this type of price dynamics, alongside surging equities in China or the US, that suggests the market is no longer pricing in a prolonged COVID-19 crisis. However, there are still contrasting signals that we must reconcile with. Why is it that the Yen remains the best performing currency in the COVID-19 era, or the Aussie, Kiwi and the Euro still so weak comparatively?
We simply can’t assume the market has looked past the COVID-19 as one of the most critical driver to set the market tone, and as a result, currency valuations. If that really was true, there are some huge opportunities to start building long inventory vs the Yen. However, by analyzing the aggregated flows into the Yen, it pains a different story. The fact that we are not seeing a bearish structure in the JP currency tells me that there is still genuine fear of what lies ahead in terms of the true impact in Chinese and global growth.
So, why the rise in equities then? There are different dynamics ruling equities (corporate buybacks, record-long bullish market, era of easing measures, Fed’s balance sheet expansion, alternative to a world with huge pool of negative yielding bonds, big bazooka stimulus by China…). All in all, while equities tells us a starkly contrasting story, currencies are still not buying into a COVID-19 ‘peak’ just yet. Nonetheless, be nimble and watch for clues as if/when the market gains more conviction that China has it well contained and is on the mend, the gap in performance between the Yen and the Oceanic currencies, even the Euro, may continue to gradually narrow.
The indices show the performance of a particular currency vs G8 FX.
Narratives In Financial Markets
* The Information is gathered after scanning top publications including the FT, WSJ, Reuters, Bloomberg, ForexLive, Institutional Bank Research reports.
US on holidays translates in quiet FX flows: Markets traded very quietly as the US was out for the President’s Day Public Holiday. With the US equity and bond markets closed, the main market movements occurred during the Asian session after yet more easing measures by the Chinese government. This time via a 10bps cut to the MLF, which alongside the reducing ‘official’ rate on COVID-19 cases helped sentiment.
Virus ‘peak’ near? No so fast... Even if the trend on the number of cases and deaths due to COVID-19 is still on the rise, the equity market keeps behaving as if we are nearing the ‘peak’. The daily change in the number of cases plays into this view as the market assumes that the containment measures in China are being effective. The impressive recovery in Chinese equities, with the CSI 300 paring its 8% fall since the re-open of markets post the Lunar-New Year portrays this optimism like no other. However, judging by the performance in bond yields or the Japanese Yen, hedges into these instruments makes for a different story-line with concerns still well and alive.
The WHO holds a cautious stance: The WHO updated the public noting that “it's too early to tell if the numbers of coronavirus cases are truly declining”, and for now “it wants to treat lower case counts cautiously.” The real issue, according to the WHO, “is whether we are seeing efficient community transmission outside of China and at the present, we are not observing that.” The market sees the glass half full though.
The latest news on COVID-19 in one place: Reuters has gathered, via a Factbox, the latest developments on coronavirus spreading in China and beyond. The death toll in mainland China reached 1,770 as of Sunday-end, up by 105 from the previous day, while there were 2,048 new cases, bringing the total count to 70,548.
RBA minutes a non-event: The RBA minutes did not add new insights to its existing stance, especially after the recent appearances by Governor Lowe and the SoMP release. The RBA continues to note that an extended period of low rates is required. Unemployment data will continue to be key to the RBA’s decision to balance out further easing vs financial stability concerns. On COVID-19, it said “coronavirus is a new source of uncertainty for the global economy, too early to judge impact.”
Japan’s Q4 GDP surprises to the downside: The Japanese Q4 GDP saw a major miss at -1.6% q/q vs -1.0% expected. The main dragger came courtesy of October’s consumption tax increase and Typhoon Hagibis. Even worse, the Q3 growth was downgraded to +0.1% q/q vs 0.5%. The fear is that COVID-19 edges the economy towards a technical recession in Q1 growth. BOJ Governor Kuroda said the virus is the biggest uncertainty for the economy and that he will not hesitate to take action if needed. The Yen was little changed after the data as the currency tends to ignore local data releases.
Tough EU-UK negotiations ahead: In a rather bold statement, French foreign minister Jean-Yves Le Drian, said Britain and the EU 'will rip each other apart' in trade talks as UK PM Johnson continues to seek out a comprehensive trade deal with the EU by the end of the year. For full insights, visit the Guardian. It’s well known the upcoming challenges that the UK will face in trade negotiations.
The UK draws its own red line: The UK’s Brexit negotiator David Frost said Britain will not sign up to follow EU standards because it would defeat the point of Brexit, saying that’s where they draw a red line in negotiations for future trading relationships. Kingdom FX has the full story. “We must have the ability to set laws that suit us. It isn’t a simple negotiating position which might move under pressure — it is the point of the whole project”, the UK's chief negotiator said.
Apple downgrades guidance: In a sign of the difficulties to keep up growth amid the COVID-19 phenomenon, Apple said it does “not expect to meet the revenue guidance provided for the March quarter” due to coronavirus related issues, with constrained iPhone supply and suppressed demand in China. CNBC carries the news.
German, UK data eyed: The German ZEW and UK employment figures will be the main events today. In the case of the German data, the market is paying close attention on whether COVID-19 is impacting investor sentiment. The consensus looks for a significant fall in expectations. Meanwhile, the UK labour market is expected to print solid figures.
Insights Into FX Index Charts
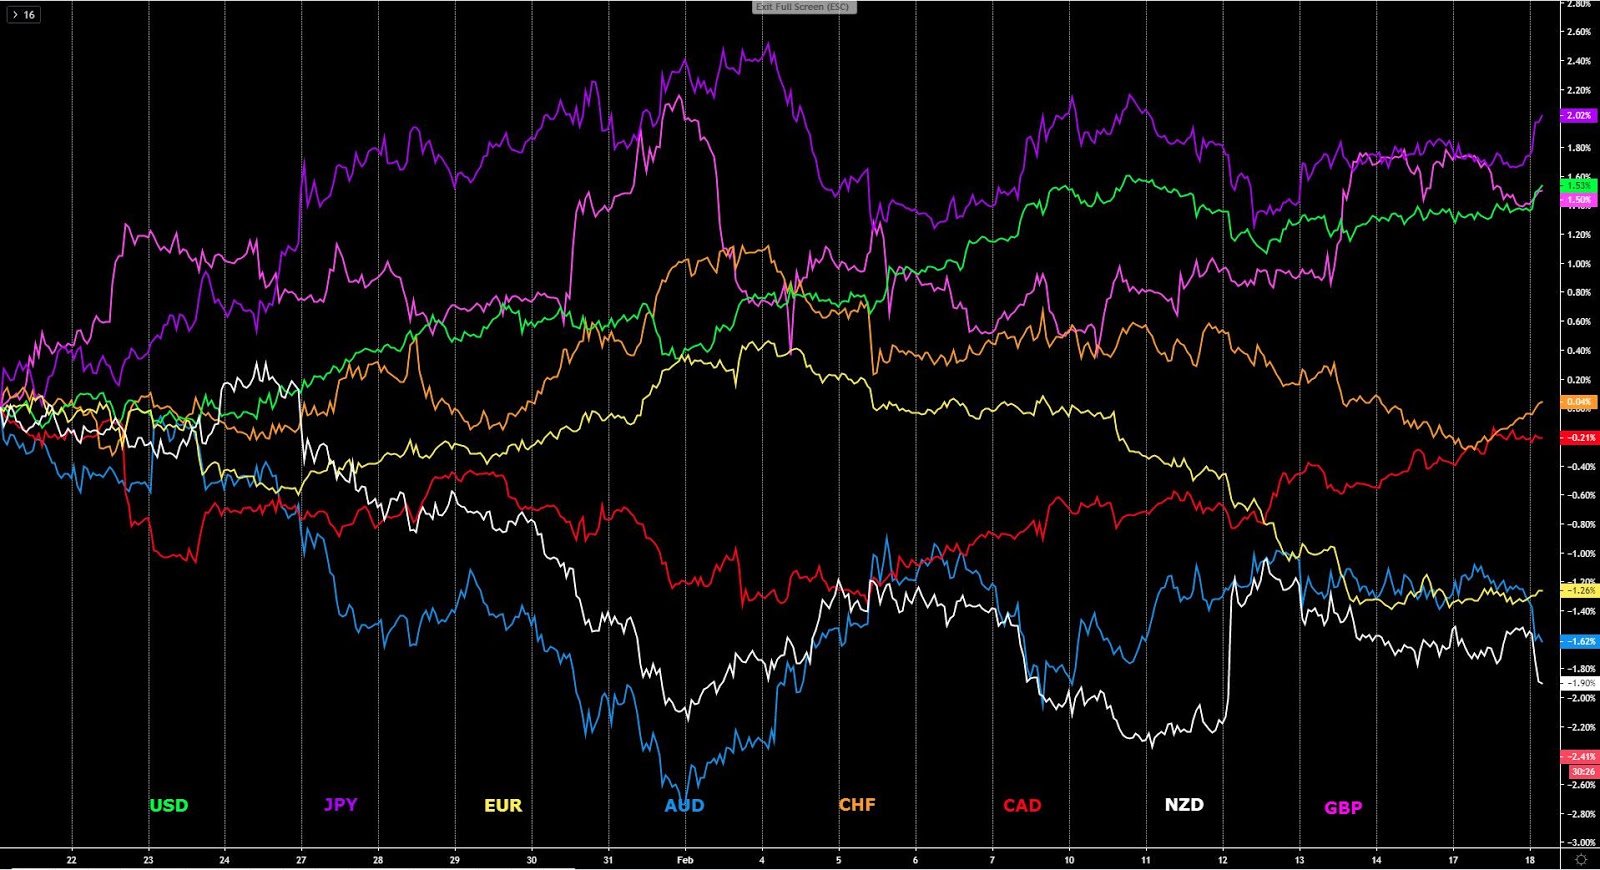
The indices show the performance of a particular currency vs G8 FX.
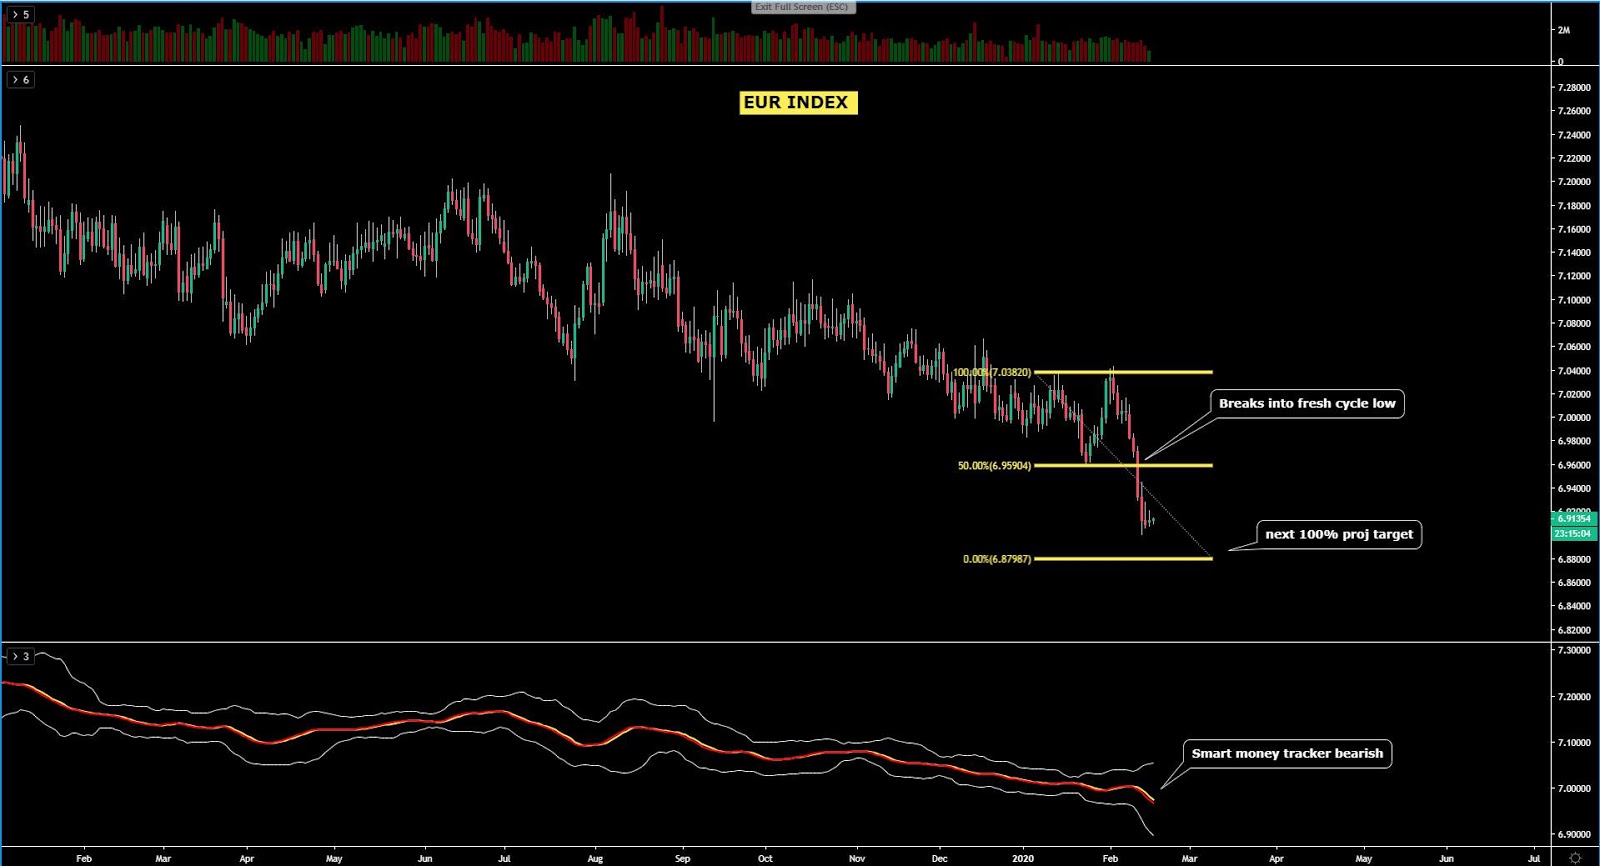
The EUR index presents no meaningful changes in the last 24h given the US holidays. The index remains en-route to target its next 100% measured movement in line with its bearish cycle. There is no technical evidence of appetite to hold EUR long inventory just yet as sellers have cemented their grip in anticipation of a more dovish ECB as China’s COVID takes its toll on German and global growth. My core view, thus remains that this is a market exploitable through sell-side action on retracements at regular intervals in line with technicals.
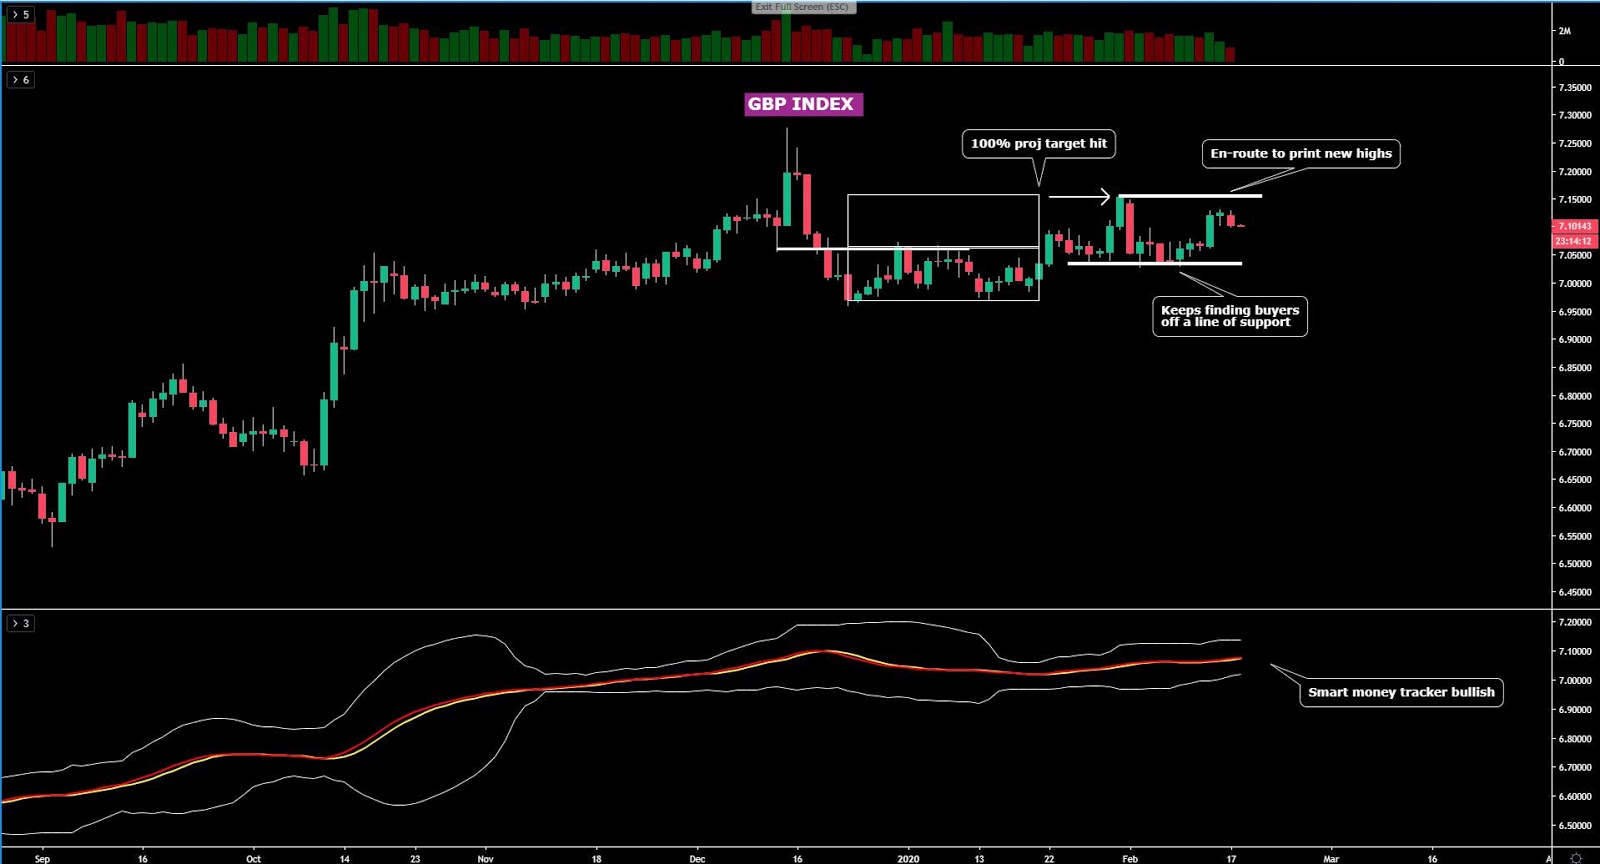
The GBP index was the weakest currency on Monday, even if price structure still supports the notion of an eventual targeting of the previous swing high, backed up by the smart money tracker and a break of structure. Opposite to what we are seeing in the Euro, this is a market that has seen the order flow shift to support buy on dips. The upside, I must say, is rather limited until confronted with the next resistance level or decision point.
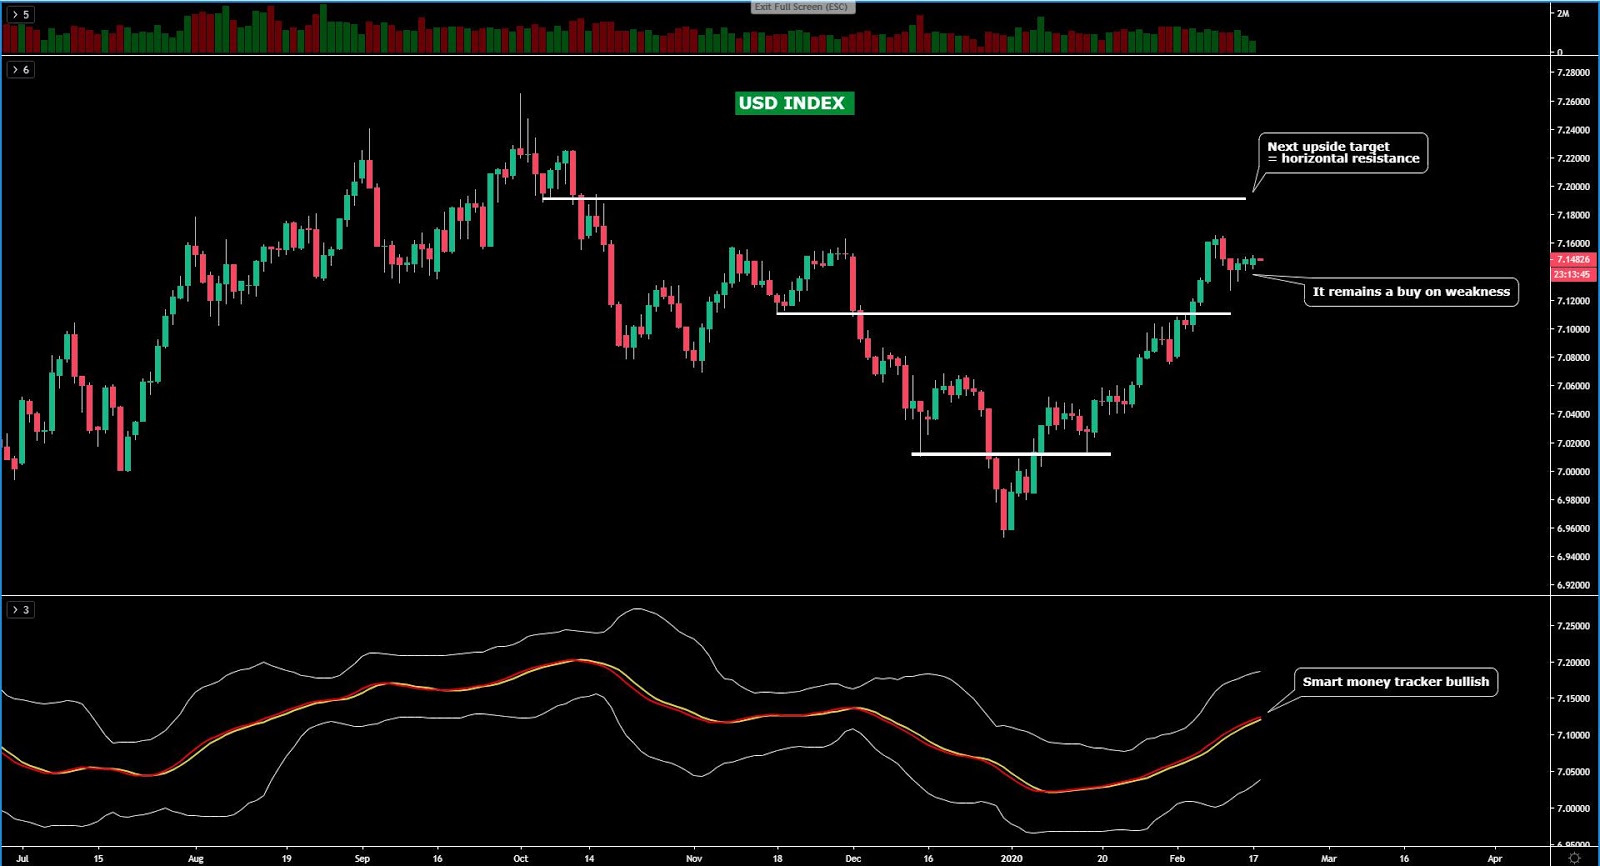
The USD index remains a market best suited to buy on dips, a trade premise that is in alignment with both the price structure and the momentum via the smart money tracker. The USD remains the top performing currency in this new decade. At the risk of sounding like a broken record, I will reiterate that this is a market where, from an intermarket perspective, has proven immune to the risk profile at play, with buying unabated regardless of risk on or risk off in the markets. Technically, there is further room to exploit to the upside until the next key level of resistance.
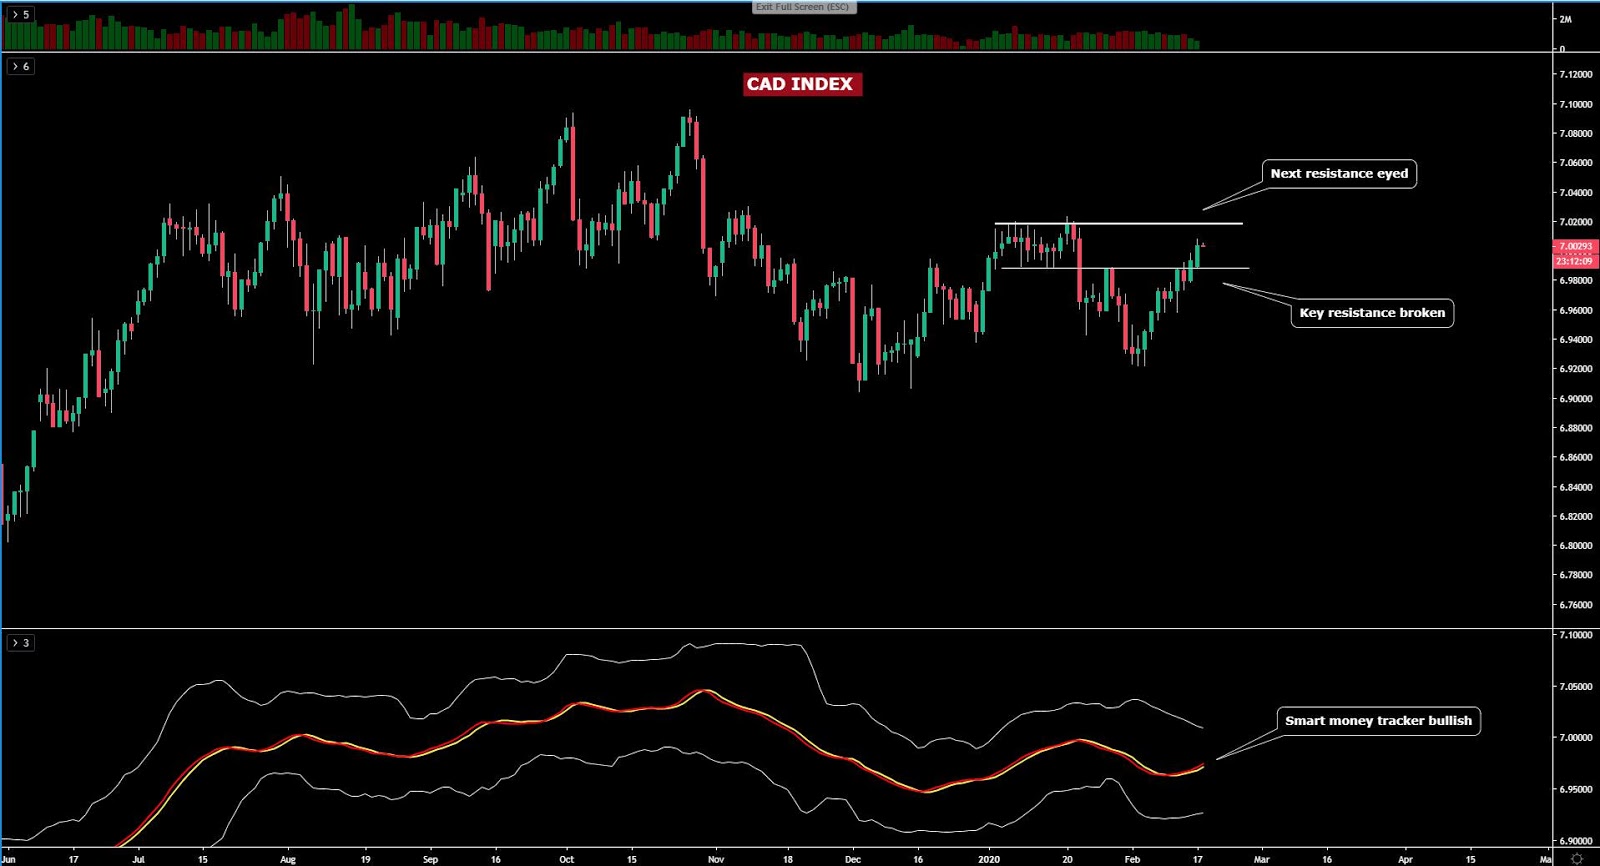
The CAD index keeps building on top of its recent gains by finding further follow-through above a key swing high that got breached last Friday. Even if the volume this break carries is suspiciously low, the preponderance of evidence through the market structure and the momentum as gauged by the smart money tracker, do support the bullish bias. Therefore, the analysis of these aggregated flows into the Canadian Dollar make me think that until proven wrong through technicals, this market has ‘buy on dips’ written all over the wall. Remember, the CAD is one of the preferred bets to get paid relatively high yields (carries a positive swap).
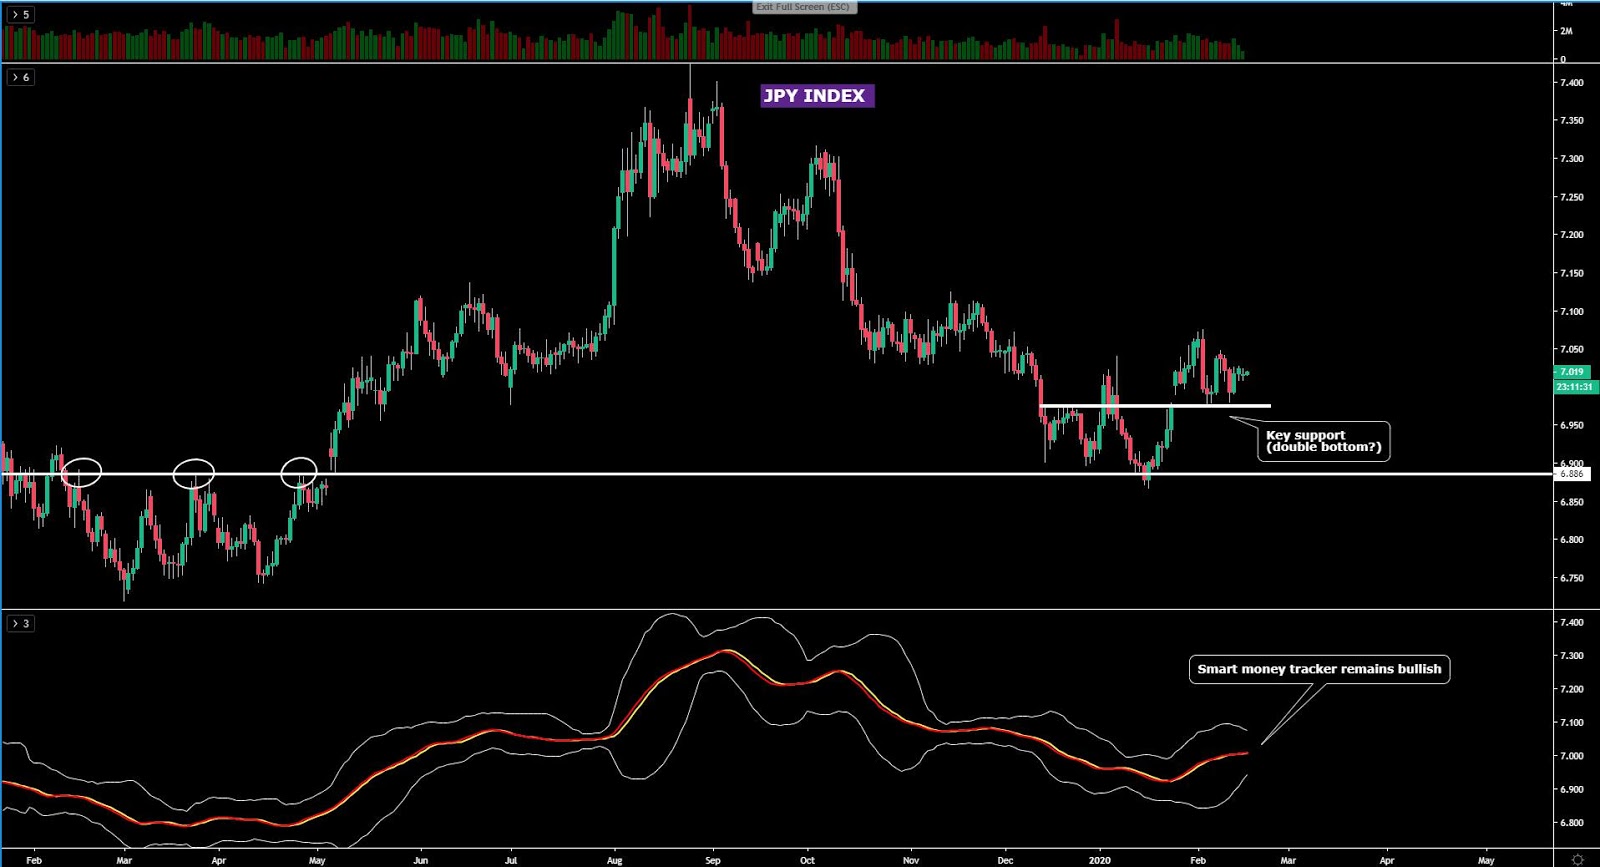
The JPY index has seen complete inaction in the last 24h of trading. As it’s well known in the forex market, the currency does not tend to be jolted by local data, hence despite the bad miss in Japan’s GDP for Q4, the currency has remained in a boring tight range. The market profile that best defines this market for now is range-bound until there is a resolution. The overall macro bias remains rather positive as the market consolidates above the previous broken swing high with the smart money tracker still pointing mildly to the upside for now.
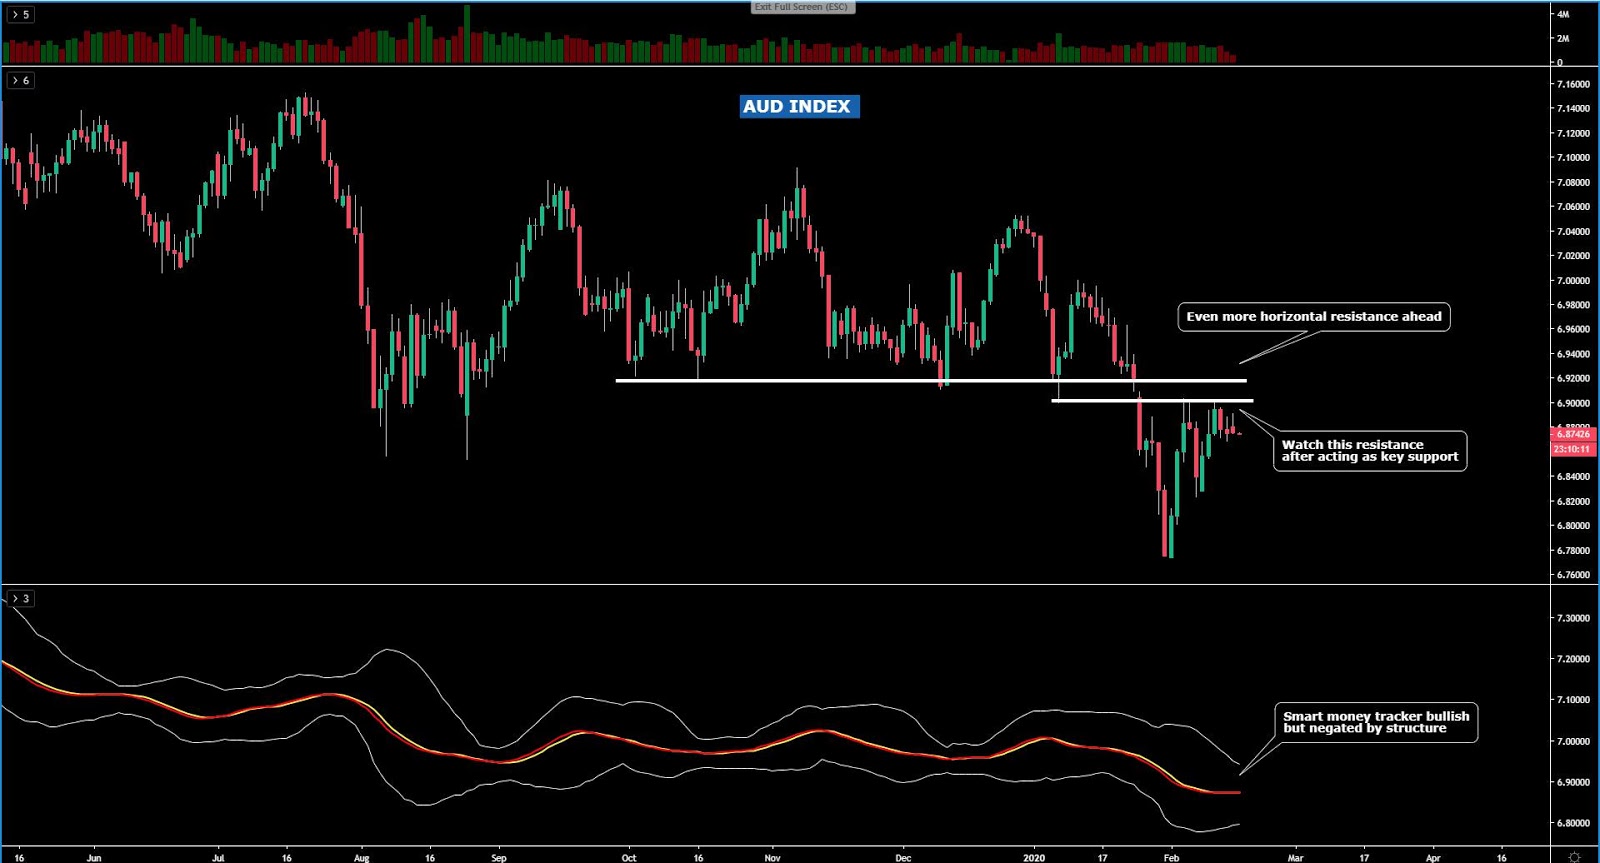
The AUD index is another market in which we will have to wait for further action if we want to distill new insights of technical information. For now, everything that I wrote in yesterday’s analysis remains true given the dullness of price fluctuations. The sticky resistance line overhead disallows further gains for now, and as a red flag, the aggregated tick volume on the second retest into this resistance has carried very low volumes, which translates in a rather negative read as a gauge to measure the commitment from buyers to break this tough technical level. The price structure of lower lows and lower highs continues to be in place, so even if the slope of the smart money tracker has turned bullish, it does not yet vindicate the bullish bias.
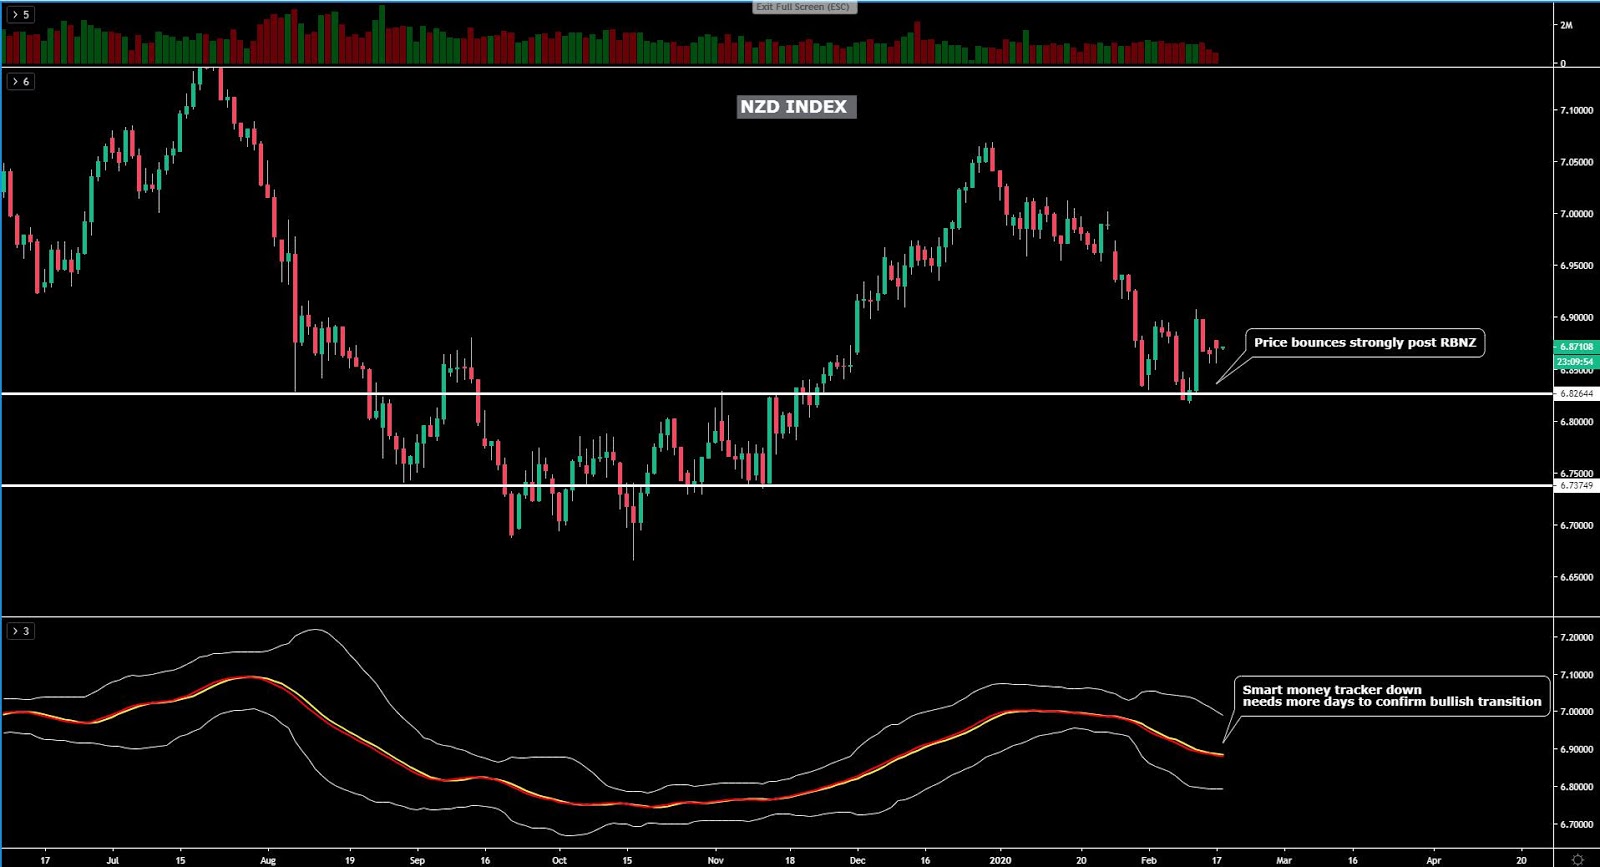
The NZD index, after breaking its previous swing high, is starting to find greater interest to buy on dips as the currency no longer trades in overbought conditions. The structure of this market has been altered, and if we keep seeing a gradual fading of the coronavirus concerns, knowing that the RBNZ aims to retain a neutral bias from now on, this is one of the most promising markets to be long in the coming months. The upside potential is quite high in my opinion.
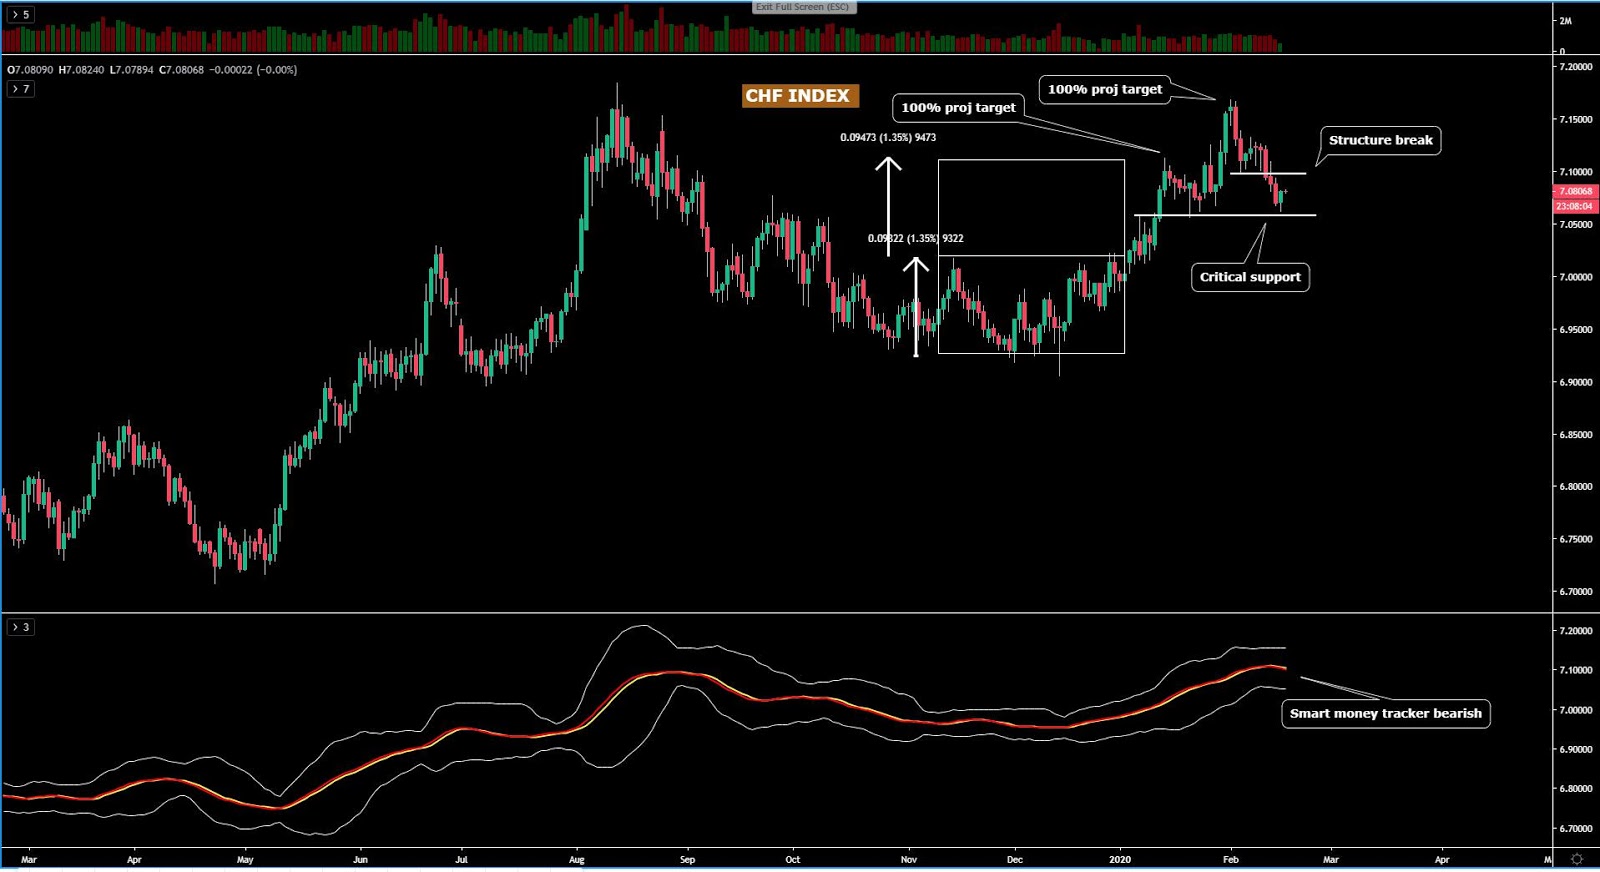
The CHF index had its first breakout of structure at a time when the smart money tracker had already re-aligned to the downside. The drop, as one would anticipate, has now made it to the next logical technical area of support, where a demand imbalance has manifested, proving me right when I mentioned in yesterday’s not that “the downside is quite limited before we encounter potential buy-side pressure on a line of support.” That said, it is my observation that the CHF buyers no longer have the upper-hand as technical readings no longer back them up. A breakout of the support underneath would open the doors to sharper falls in the index.
Important Footnotes
- Market structure: Markets evolve in cycles followed by a period of distribution and/or accumulation.
- Horizontal Support/Resistance: Unlike levels of dynamic support or resistance or more subjective measurements such as Fibonacci retracements, pivot points, trendlines, or other forms of reactive areas, the horizontal lines of support and resistance are universal concepts used by the majority of market participants. It, therefore, makes the areas the most widely followed and relevant to monitor.
- Fundamentals: It’s important to highlight that the daily market outlook provided in this report is subject to the impact of the fundamental news. Any unexpected news may cause the price to behave erratically in the short term.
- Projection Targets: The usefulness of the 100% projection resides in the symmetry and harmonic relationships of market cycles. By drawing a 100% projection, you can anticipate the area in the chart where some type of pause and potential reversals in price is likely to occur, due to 1. The side in control of the cycle takes profits 2. Counter-trend positions are added by contrarian players 3. These are price points where limit orders are set by market-makers.
