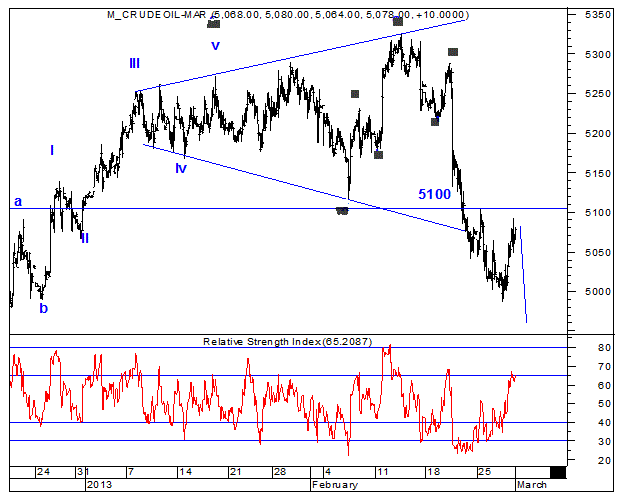
In last two months (January – February 2013) MCX Crude oil consolidated within the expanding pattern. Recently prices have exactly reversed from the upward-sloping trendline of the pattern and moved lower.
Along with simple technical analysis, Elliott wave theory helped us to capture the top and moved lower. Below is the charts picked up from “The Commodity waves STU” (Commodity report) where we have been accurate in conquering the fall of more than 150 points within three trading sessions.
Momentum indicator RSI has relieved the oversold position and arrived near the resistance of 70. From current level we do not expect prices to cross the strong resistance of 5100 and once again it should move lower. As long as 5100 is intact on upside trend remains negative. A move below 5040 will provide the selling opportunity and prices can move lower towards 4980/4950 levels”. BANG ON!
MCX Crude moved in lines with our expectations. Prices reversed exactly from 5100 levels, continued the downtrend and achieved the mentioned level of 4950.
As per wave perspective, prices have completed wave….. near 5100 levels and started the next leg…… in the form of wave…..
Too many might have not able to trade the downtrend in Crude. However, there is more steam left on downside in this commodity.
- English (UK)
- English (India)
- English (Canada)
- English (Australia)
- English (South Africa)
- English (Philippines)
- English (Nigeria)
- Deutsch
- Español (España)
- Español (México)
- Français
- Italiano
- Nederlands
- Português (Portugal)
- Polski
- Português (Brasil)
- Русский
- Türkçe
- العربية
- Ελληνικά
- Svenska
- Suomi
- עברית
- 日本語
- 한국어
- 简体中文
- 繁體中文
- Bahasa Indonesia
- Bahasa Melayu
- ไทย
- Tiếng Việt
- हिंदी
Whats Behind Crude Oil Selloff?
Published 03/08/2013, 10:40 AM
Updated 05/14/2017, 06:45 AM
Whats Behind Crude Oil Selloff?
Latest comments
Loading next article…
Install Our App
Risk Disclosure: Trading in financial instruments and/or cryptocurrencies involves high risks including the risk of losing some, or all, of your investment amount, and may not be suitable for all investors. Prices of cryptocurrencies are extremely volatile and may be affected by external factors such as financial, regulatory or political events. Trading on margin increases the financial risks.
Before deciding to trade in financial instrument or cryptocurrencies you should be fully informed of the risks and costs associated with trading the financial markets, carefully consider your investment objectives, level of experience, and risk appetite, and seek professional advice where needed.
Fusion Media would like to remind you that the data contained in this website is not necessarily real-time nor accurate. The data and prices on the website are not necessarily provided by any market or exchange, but may be provided by market makers, and so prices may not be accurate and may differ from the actual price at any given market, meaning prices are indicative and not appropriate for trading purposes. Fusion Media and any provider of the data contained in this website will not accept liability for any loss or damage as a result of your trading, or your reliance on the information contained within this website.
It is prohibited to use, store, reproduce, display, modify, transmit or distribute the data contained in this website without the explicit prior written permission of Fusion Media and/or the data provider. All intellectual property rights are reserved by the providers and/or the exchange providing the data contained in this website.
Fusion Media may be compensated by the advertisers that appear on the website, based on your interaction with the advertisements or advertisers.
© 2007-2025 - Fusion Media Limited. All Rights Reserved.
