The recent drop in gold and silver is not critical to buyers of physical metals. Rather, it is an opportunity – to buy more at lower prices; at worst, it is an irritation, since it means a longer wait. It would likely be critical only if the gold bull market is over, and prices do not rise higher than the 2011 highs for many years.
If you are buying paper gold (especially leveraged), then a drop like the current drop is likely to be critical. On top of that, the ride is almost guaranteed to remain painful, even if gold moves to $5000 over the next 2 years, due to extreme volatility.
It is important to try and identify good opportunities to buy more gold and silver (at the lowest prices), and to stay invested, for the most part of the bull market. Selling would only become an issue when the bull market is at an end (close to the top).
So, has the gold bull market come to an end?
In my previous article, I provided an analysis of whether I think this gold bull market is over or not, using the relationship between the Dow and gold. Based on that analysis, it is unlikely that both the Dow and gold are going to make new significant all-time highs from here. We have to decide whether it is equities that will continue a bull market from here, or gold.
Let’s look at gold patterns to see if we can find a possible level for the bottom. Below is a 7-year gold chart: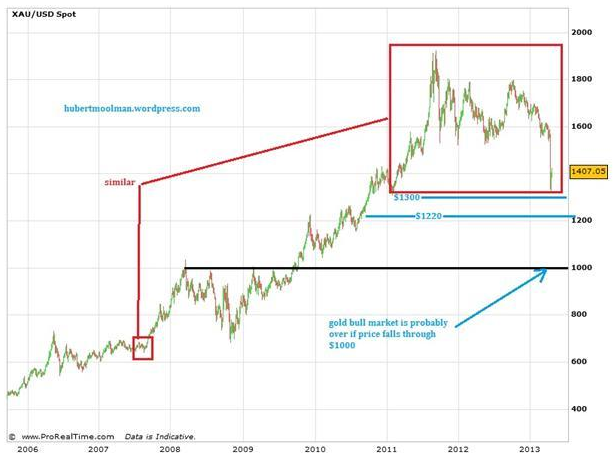 XAU/USD Spot" title="XAU/USD Spot" width="613" height="463">
The first thing I would like to point out is the fact that a drop to the $1000 is possible. I do not believe that it is the case, however. If it goes to $1000 level, then it is unlikely that it will go there soon as part of this drop. It would most likely take a couple of years to get there.
What is interesting however, is the fact that if gold does a bottom similar to 1976, it would go to around $1000. That is a 60% decline of the move from the bottom of this bull market ($250) to the top at $1920.
Note that a drop below $1000 would probably mean that the gold bull market is over.
A bottom of $1300 is the call I am going with. It is consistent with where I think the gold market is. I believe we are close to a major rally, very similar to the 1973 and 1979 rallies. If this is the case, then there should be a very bullish pattern present on the gold chart.
The patterns highlighted in red are the most bullish I know. It is not a conventional pattern seen with traditional technical analysis. Based on the standard dimensions of this pattern, we should get an ideal bottom at $1300. If gold does not go lower than the $1300 level over the next couple of weeks, then this pattern could be valid. Gold will then rally like it did in 1973 and 1979.
I believe that the drop below $1,522 is still part of the consolidating pattern since 2011, and not a break-down of that pattern. In other words, it is similar to the 2006/2007 and 2008/2009 consolidations, but with its major low right at the end, instead of at the beginning or close to the middle.
The $1300 level also represents a 50% retracement of the move from the $680 level in 2008, to the top at $1920. This is similar to the retracement we had in 1973, before the big rally.
- English (UK)
- English (India)
- English (Canada)
- English (Australia)
- English (South Africa)
- English (Philippines)
- English (Nigeria)
- Deutsch
- Español (España)
- Español (México)
- Français
- Italiano
- Nederlands
- Português (Portugal)
- Polski
- Português (Brasil)
- Русский
- Türkçe
- العربية
- Ελληνικά
- Svenska
- Suomi
- עברית
- 日本語
- 한국어
- 简体中文
- 繁體中文
- Bahasa Indonesia
- Bahasa Melayu
- ไทย
- Tiếng Việt
- हिंदी
What Will Be The Possible Target For The Bottom In Gold?
Published 04/20/2013, 03:22 AM
Updated 05/14/2017, 06:45 AM
What Will Be The Possible Target For The Bottom In Gold?
Latest comments
Loading next article…
Install Our App
Risk Disclosure: Trading in financial instruments and/or cryptocurrencies involves high risks including the risk of losing some, or all, of your investment amount, and may not be suitable for all investors. Prices of cryptocurrencies are extremely volatile and may be affected by external factors such as financial, regulatory or political events. Trading on margin increases the financial risks.
Before deciding to trade in financial instrument or cryptocurrencies you should be fully informed of the risks and costs associated with trading the financial markets, carefully consider your investment objectives, level of experience, and risk appetite, and seek professional advice where needed.
Fusion Media would like to remind you that the data contained in this website is not necessarily real-time nor accurate. The data and prices on the website are not necessarily provided by any market or exchange, but may be provided by market makers, and so prices may not be accurate and may differ from the actual price at any given market, meaning prices are indicative and not appropriate for trading purposes. Fusion Media and any provider of the data contained in this website will not accept liability for any loss or damage as a result of your trading, or your reliance on the information contained within this website.
It is prohibited to use, store, reproduce, display, modify, transmit or distribute the data contained in this website without the explicit prior written permission of Fusion Media and/or the data provider. All intellectual property rights are reserved by the providers and/or the exchange providing the data contained in this website.
Fusion Media may be compensated by the advertisers that appear on the website, based on your interaction with the advertisements or advertisers.
© 2007-2025 - Fusion Media Limited. All Rights Reserved.